
![[OC] 60 days of bird feeder visits](https://www.byteseu.com/wp-content/uploads/2025/04/p5ubywk16lxe1-1536x850.jpeg "[OC] 60 days of bird feeder visits")
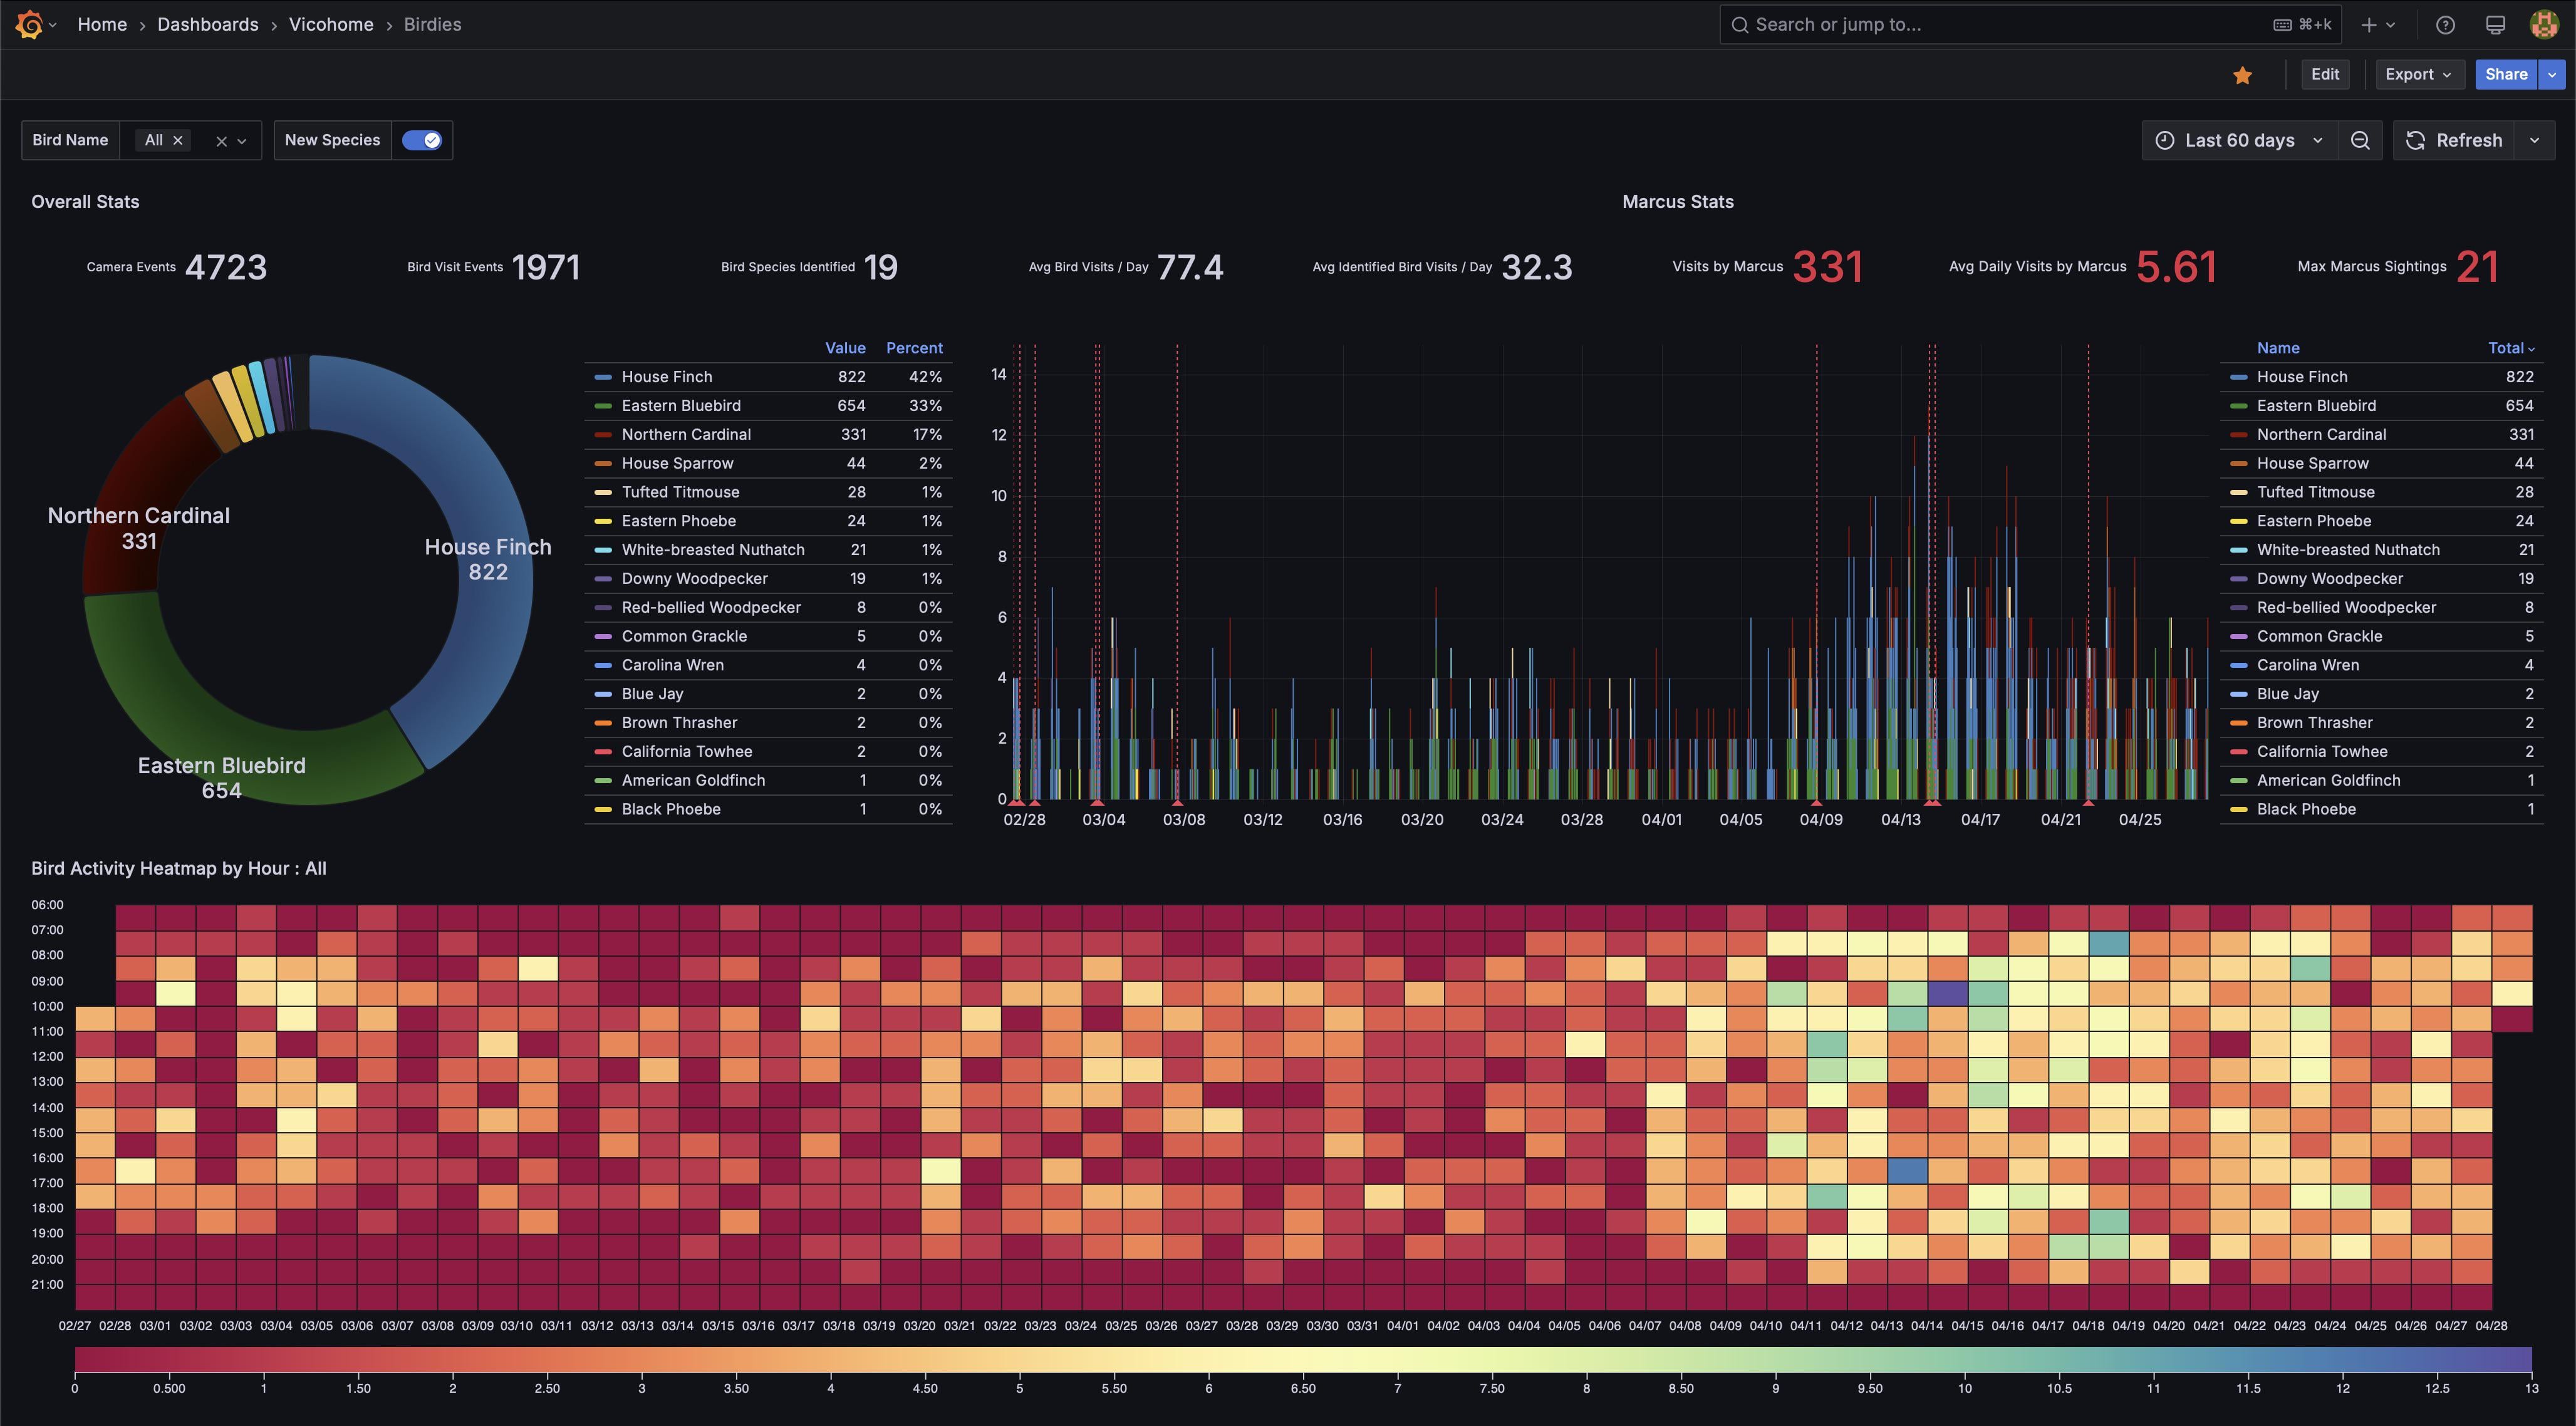
I spent a lot of time reverse engineering the API my bird feeder camera events get sent to. After getting access to it in a raw format, throwing it into influx was straightforward. It’s still sort of hackey, but that extractor is on GitHub here: https://github.com/dydx/vico-cli
We just have the one feeder on the porch and kept seeing it get more popular with the local birds. I wanted to understand more about who all is coming and when.
It’s crazy that I can see when spring really seemed to hit.
Hoping to include some local weather and air data in here too at some point. Also taking images for birds it could not identify and attempting to identify them to fill in gaps. Will update if/when I do.
Posted by d2xdy2
8 Comments
Very fun, but making the colour for a “bluebird” green is funny to me (I’m sure the colours are generated by the system itself, right?)
This is nerd^(2) material right here. Pretty neat.
This is a thing of beauty
How’d you get the bird species? Manual or do you have the pro thing that tells you what shows up? I know mine gets a lot of false positives throughout the day
I need this level of cool autism
i have a db with several records how do I generate this type of chart against usage of each record.
I love this. Reminds me of this artist/data scientist who toook all the data from ebird to track similar things: https://www.jerthorp.me/every-bird
I saw a grafana dashboard and thought mmm devops. Then I saw the github and was like who tf are you are your golang-fu. Good god. If you wrote that, that is some clean code, that deserves it’s own applause!