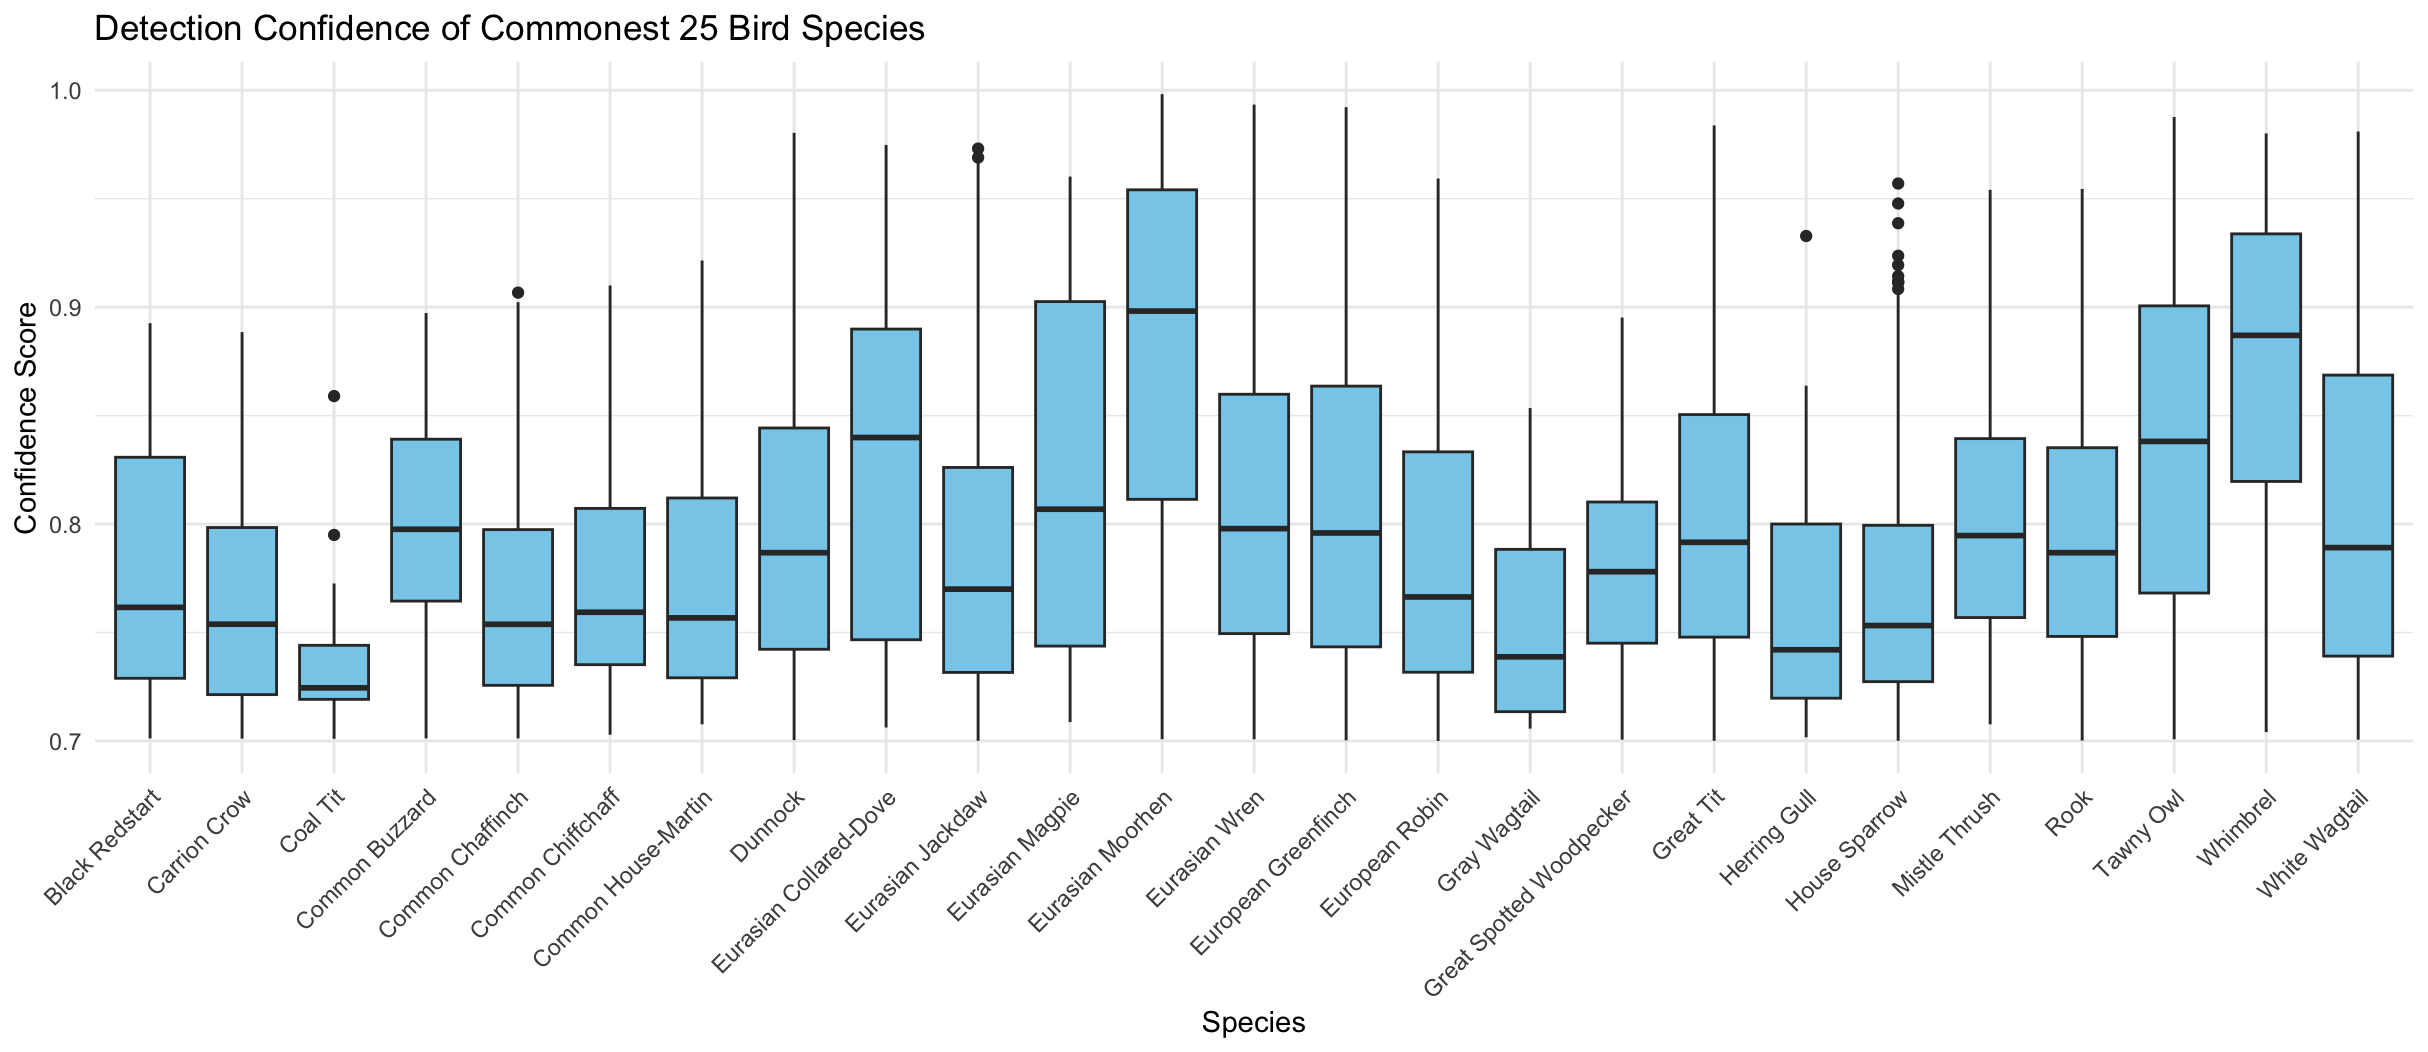
Share Facebook Twitter LinkedIn Pinterest Bluesky Threads ID Confidence for most common 25 species in the garden. Posted by Gravitykarma
itijara on May 6, 2025 7:40 pm How long a time period is this for? A day, a year, a week? How many observations is this for? Presumably each boxplot represents a distribution of observations. Pretty cool device: [https://www.birdweather.com/birdnetpi](https://www.birdweather.com/birdnetpi)

![[OC] More Birdnet data - confidence plots.](https://www.byteseu.com/wp-content/uploads/2025/05/02988e5ym7ze1-1536x666.png "[OC] More Birdnet data – confidence plots.")
2 Comments
Data from Birdnet-Pi in garden
Tool: R Studio and ggplot.
How long a time period is this for? A day, a year, a week? How many observations is this for? Presumably each boxplot represents a distribution of observations.
Pretty cool device: [https://www.birdweather.com/birdnetpi](https://www.birdweather.com/birdnetpi)