Looked quickly at the source – Are people in the US spending $6k a month and paying it off (in which case cool) or are they carrying an average of $6k and paying off the minimum (in which was WTF America!)
Jdp1901 on
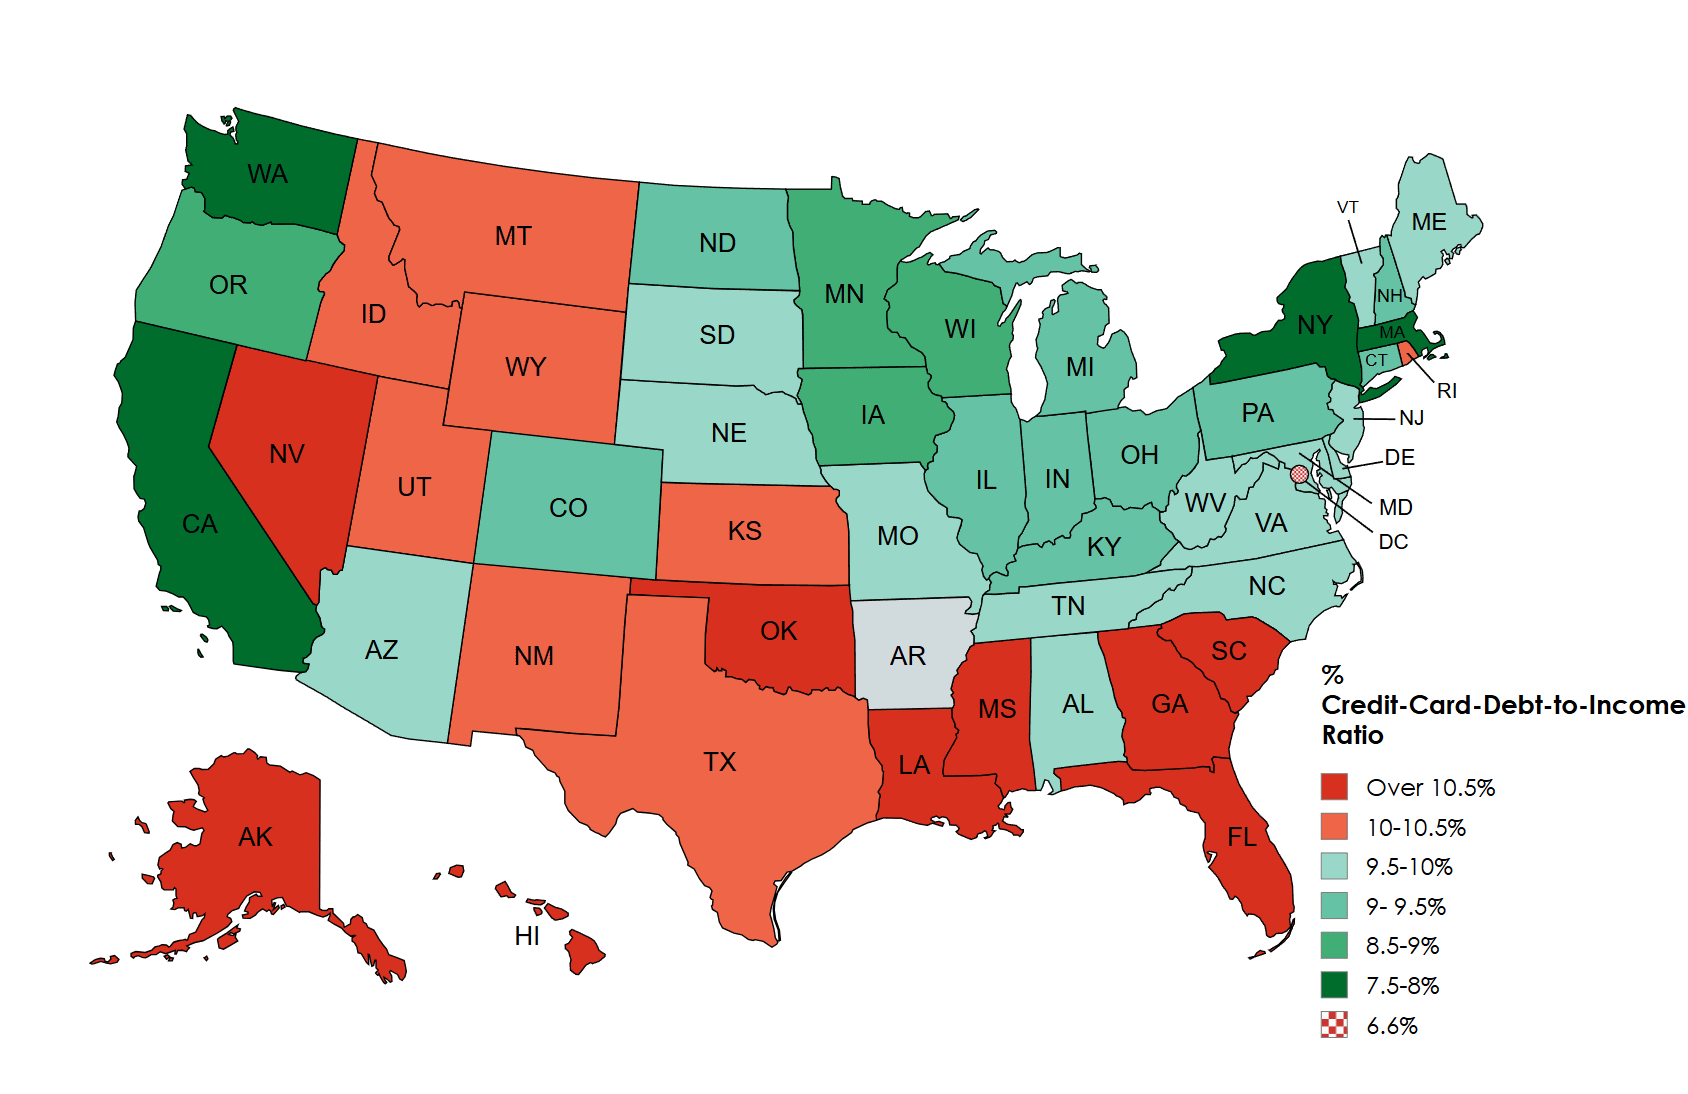
So the majority of the united states is 9% +/- 1%? Not a huge spread.
Synfinium on
Oh uh I just noticed I forgot to include Arkansas. The % for Arkansas is 10.2%
galileopunk on
Huh! Why is Alabama so much greener than the states around it?
iomars on
Friendly feedback, Colors pallet is not great
Some_Ask_2220 on
Color coding could be a bit better but yikes
TimHuntsman on
Interesting the delta between credit card debt and overall debt. Funny tho, UT tops it in both (I live here) and the trend is to “out-do the Smiths”
Practical_Estate_325 on
Anyone else notice the political elephant in the room?
Nervous_Pop8879 on
OP hates colorblind people.
Orwell1971 on
darker meaning higher would be more intuitive imo (which you basically did for orange/red, making it extra misleading)
Neostylis on
The data is interesting but I’m a little worried about the color scheme being misleading. Why does the color scale change abruptly from green to red? Judging by color the similarity of a pair of states doesn’t seem related to the difference numerically. Two states at 9.6% and 7.6% would both be green but two states at 9.6% and 10.6% would have completely different colors despite being closer numerically.
MeechDaStudent on
We need to let Florida lead the education system
Sunday-Afternoon on
You picked very poor colors for this. It should be an intuitive transition across a spectrum to go from high to low.
You picked a dark red color and got lighter before switching to light green and then got dark again. God help the colorblind. Pick a color and use a gradient or maybe go from warm colors to cooler colors – something your brain can immediately understand.
african_cheetah on
More sunshine. More spending. More debt.
xxearvinxx on
This perfectly shows why California, Washington, New York and Massachusetts are better than most people think for standard of living.
Some people will disagree, but earning more money is worth the increased taxes and higher cost of living that those states impose. At the end of the day you will still likely have more money leftover (disposable income) and less debt.
A Toyota Camry, new iPhone, random gadget from Amazon, a vacation to Europe, etc. all cost basically the same whether you live in Seattle making $150k or Mississippi make 65k, you just spend a much smaller portion of your income on those things in the higher income states.
gioakjoe on
Places with higher mortgages are harder to get more credit card debt than places with smaller mortgages.
prepend on
Can we add a sidebar about visualizations that lack basic characteristics like their source data?
Is this average debt per household? Just total credit card debit/GDP?
It’s an interesting idea, but I would hope that any client who received this would not be happy with it.
Jets237 on
The fact that the wealthiest states are the greenest doesn’t mean the average citizen is better off, likely the extremes pulling it up
Nutmegdog1959 on
Why do you think they’re called Red States?
Dexller on
I’m shocked Alabama is so low.
Ph_r_x on
Gotta take into account purchasing power in each state.
Anothereternity on
What actually is this? It doesn’t say how it’s calculated? Is it average? Is it median?
NumbN00ts on
I’d be curious to see this but for Canada.
ocelot08 on
oof, I dont know that green properly conveys the situation
fromwhichofthisoak on
Who would think the best states in education
Doumtabarnack on
So republican states are more irresponsible with their money?
AnonymousJman on
If the lowest amount is 6.6%, you people are seriously stupid. Carrying any credit card debt is ridiculous.
brewz_wayne on
Oh look, it’s those red states again.
theslob on
Funny how no matter what the graphic represents, the south is always the worst.
Maloquinn84 on
Look at all those red states!
Jack_Wight on
Wow the south is terrible at managing debt.
andherBilla on
Does monthly balance counts as credit card debt or only if you incur interest on it?

![[OC] Credit card debt to income](https://www.byteseu.com/wp-content/uploads/2025/05/ydxdr7zqy80f1-1536x995.png "[OC] Credit card debt to income")
35 Comments
Tools used : mapcharts.net
Source : https://www.experian.com/blogs/ask-experian/state-of-credit-cards/
Something something Republicans fiscal responsibility something something
What’s going on in Rhode Island?
Looked quickly at the source – Are people in the US spending $6k a month and paying it off (in which case cool) or are they carrying an average of $6k and paying off the minimum (in which was WTF America!)
So the majority of the united states is 9% +/- 1%? Not a huge spread.
Oh uh I just noticed I forgot to include Arkansas. The % for Arkansas is 10.2%
Huh! Why is Alabama so much greener than the states around it?
Friendly feedback, Colors pallet is not great
Color coding could be a bit better but yikes
Interesting the delta between credit card debt and overall debt. Funny tho, UT tops it in both (I live here) and the trend is to “out-do the Smiths”
Anyone else notice the political elephant in the room?
OP hates colorblind people.
darker meaning higher would be more intuitive imo (which you basically did for orange/red, making it extra misleading)
The data is interesting but I’m a little worried about the color scheme being misleading. Why does the color scale change abruptly from green to red? Judging by color the similarity of a pair of states doesn’t seem related to the difference numerically. Two states at 9.6% and 7.6% would both be green but two states at 9.6% and 10.6% would have completely different colors despite being closer numerically.
We need to let Florida lead the education system
You picked very poor colors for this. It should be an intuitive transition across a spectrum to go from high to low.
You picked a dark red color and got lighter before switching to light green and then got dark again. God help the colorblind. Pick a color and use a gradient or maybe go from warm colors to cooler colors – something your brain can immediately understand.
More sunshine. More spending. More debt.
This perfectly shows why California, Washington, New York and Massachusetts are better than most people think for standard of living.
Some people will disagree, but earning more money is worth the increased taxes and higher cost of living that those states impose. At the end of the day you will still likely have more money leftover (disposable income) and less debt.
A Toyota Camry, new iPhone, random gadget from Amazon, a vacation to Europe, etc. all cost basically the same whether you live in Seattle making $150k or Mississippi make 65k, you just spend a much smaller portion of your income on those things in the higher income states.
Places with higher mortgages are harder to get more credit card debt than places with smaller mortgages.
Can we add a sidebar about visualizations that lack basic characteristics like their source data?
Is this average debt per household? Just total credit card debit/GDP?
It’s an interesting idea, but I would hope that any client who received this would not be happy with it.
The fact that the wealthiest states are the greenest doesn’t mean the average citizen is better off, likely the extremes pulling it up
Why do you think they’re called Red States?
I’m shocked Alabama is so low.
Gotta take into account purchasing power in each state.
What actually is this? It doesn’t say how it’s calculated? Is it average? Is it median?
I’d be curious to see this but for Canada.
oof, I dont know that green properly conveys the situation
Who would think the best states in education
So republican states are more irresponsible with their money?
If the lowest amount is 6.6%, you people are seriously stupid. Carrying any credit card debt is ridiculous.
Oh look, it’s those red states again.
Funny how no matter what the graphic represents, the south is always the worst.
Look at all those red states!
Wow the south is terrible at managing debt.
Does monthly balance counts as credit card debt or only if you incur interest on it?