Pretty noticeable that cities with higher education seem to vote a specific way. Cool graph!
YS15118 on
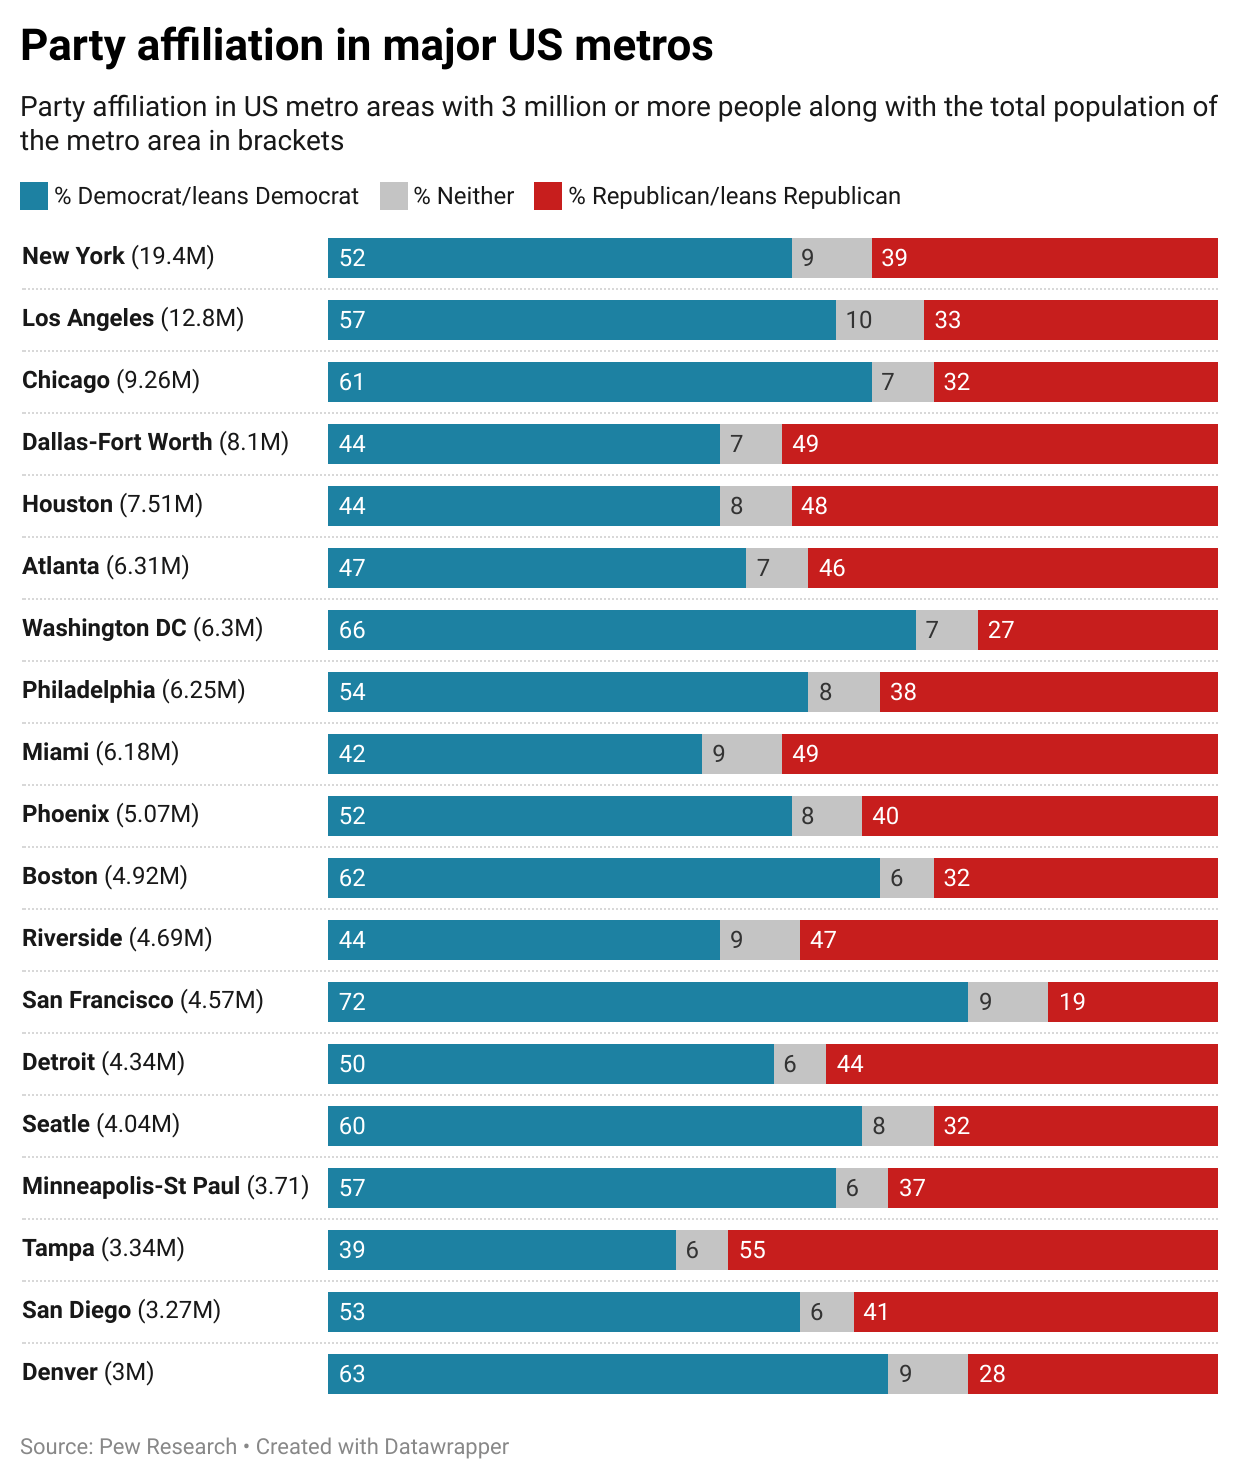
Why is Tampa so fucking stupid?
CalgaryChris77 on
How is this measured? Do 90% of people in the US really belong to one party or the other?
Ian_Patrick_Freely on
Can we get an alternate cut where cities are arranged by % rather than by population?
personofinterest18 on
I wish this had some sort of sorting to it or alphabetized cities or something
TorontoTom2008 on
Basically if it’s hot and not in California = Republican.
ReidBuch on
As someone who lives in Tampa. I’d say it’s more red than that. But maybe that’s just my circle
Don_Q_Jote on
I’m surprised the “neither” category is so small.
I find it hard to believe that >90% are truly aligned with a political party. I wonder how the researchers define “party affiliation”. I live in a state with open primaries. So I don’t ever have to officially declare a party affiliation. Depending on candidates/races, I have voted for both parties over the years. It this really so rare?
So I vote a majority of the time for one party. I would never define myself as “affiliated” with that party.
Is this showing anything materially different than election results? Bay Area seems roughly aligned with votes for Harris vs Trump. Are any of these drastically different?
jeffwinger_esq on
I bet NYC without Staten Island is much, much more Democratic.
Hmmhowaboutthis on
The Houston one really surprised me as a Houstonian until I read more carefully that it includes the metro area. The burbs are pretty red—the city *very* blue.
prediction_interval on
The exact wording is:
> [FIRST] In politics today, do you consider yourself a … Republican; Democrat; Independent; something else. [THEN] As of today do you lean more to … the Republican Party; the Democratic Party.
Then those two questions are combined into:
> % of adults in the [city] metro area who identify as …
> * Rep/lean Rep
> * No lean
> * Dem/lean Dem
rollem on
It’s a good reminder that even very partisan areas have a sizable population of the minority party.
This is one reason I don’t *think* we’re headed towards anything like a civil war- the regional differences are just not that stark. I could of course be wrong, but it’s not like it was back then.
Bostonlegalthrow on
The NYC numbers looked fishy (NYC generally votes democrat like 80/20) so I found the voter registration numbers:
I get there’s probably some grey area with “metro area” but I have a hard time believing it’s as close as the graph shows.
Peyta12 on
Odd that DC has only 66% registered as democrats but Harris won 90% of the vote there.
j_ly on
There’s 2 “t”s in Seattle, and now I can’t unsee it!
OreoSpeedwaggon on
I’d be interested to see the same metropolitan areas sorted by square miles to see how they compare to the population.
L192837465 on
This doesn’t surprise anyone. Trumps main voter base was the uneducated rural population that relies far more on government subsidies than most people realize. Farmers in particular voted OVERWHELMINGLY for a man who flat out called them “freeloaders”.
FYI, almost every farm in the US is subsidied and are corporate owned (Monsanto has the lions share). Farmers, selling their own crops, couldn’t afford to farm without them.
LAST2thePARTY on
Phoenix and New York being almost identical is surprising
lmboyer04 on
There’s no way this is accurate in DC. DC consistently votes in the 90 percents blue
Zigxy on
A lot of those California Republicans are very different from the Texas Republicans
ColonelBoomer on
ITs funny how the super democratic cities are also some of the shittiest in the country.
porkycornholio on
I’m looking for crime statistics than include political affiliation as a dimension. Is anyone familiar with anything along these lines?

![[OC] Party affiliation in major US metros](https://www.byteseu.com/wp-content/uploads/2025/05/m6ycptfs3y0f1-858x1024.png "[OC] Party affiliation in major US metros")
24 Comments
Source: [Pew Research](https://www.pewresearch.org/religious-landscape-study/)
Tools: [Datawrapper](https://www.datawrapper.de/)
Pretty noticeable that cities with higher education seem to vote a specific way. Cool graph!
Why is Tampa so fucking stupid?
How is this measured? Do 90% of people in the US really belong to one party or the other?
Can we get an alternate cut where cities are arranged by % rather than by population?
I wish this had some sort of sorting to it or alphabetized cities or something
Basically if it’s hot and not in California = Republican.
As someone who lives in Tampa. I’d say it’s more red than that. But maybe that’s just my circle
I’m surprised the “neither” category is so small.
I find it hard to believe that >90% are truly aligned with a political party. I wonder how the researchers define “party affiliation”. I live in a state with open primaries. So I don’t ever have to officially declare a party affiliation. Depending on candidates/races, I have voted for both parties over the years. It this really so rare?
So I vote a majority of the time for one party. I would never define myself as “affiliated” with that party.
https://preview.redd.it/yoga2a09ay0f1.jpeg?width=345&format=pjpg&auto=webp&s=4b1fb17ea492bebce587a28ca5e70cbfa0fe10c6
Is this showing anything materially different than election results? Bay Area seems roughly aligned with votes for Harris vs Trump. Are any of these drastically different?
I bet NYC without Staten Island is much, much more Democratic.
The Houston one really surprised me as a Houstonian until I read more carefully that it includes the metro area. The burbs are pretty red—the city *very* blue.
The exact wording is:
> [FIRST] In politics today, do you consider yourself a … Republican; Democrat; Independent; something else. [THEN] As of today do you lean more to … the Republican Party; the Democratic Party.
Then those two questions are combined into:
> % of adults in the [city] metro area who identify as …
> * Rep/lean Rep
> * No lean
> * Dem/lean Dem
It’s a good reminder that even very partisan areas have a sizable population of the minority party.
This is one reason I don’t *think* we’re headed towards anything like a civil war- the regional differences are just not that stark. I could of course be wrong, but it’s not like it was back then.
The NYC numbers looked fishy (NYC generally votes democrat like 80/20) so I found the voter registration numbers:
[https://vote.nyc/page/voter-enrollment-totals](https://vote.nyc/page/voter-enrollment-totals)
NYC has 6:1 Dem to Rep?
I get there’s probably some grey area with “metro area” but I have a hard time believing it’s as close as the graph shows.
Odd that DC has only 66% registered as democrats but Harris won 90% of the vote there.
There’s 2 “t”s in Seattle, and now I can’t unsee it!
I’d be interested to see the same metropolitan areas sorted by square miles to see how they compare to the population.
This doesn’t surprise anyone. Trumps main voter base was the uneducated rural population that relies far more on government subsidies than most people realize. Farmers in particular voted OVERWHELMINGLY for a man who flat out called them “freeloaders”.
FYI, almost every farm in the US is subsidied and are corporate owned (Monsanto has the lions share). Farmers, selling their own crops, couldn’t afford to farm without them.
Phoenix and New York being almost identical is surprising
There’s no way this is accurate in DC. DC consistently votes in the 90 percents blue
A lot of those California Republicans are very different from the Texas Republicans
ITs funny how the super democratic cities are also some of the shittiest in the country.
I’m looking for crime statistics than include political affiliation as a dimension. Is anyone familiar with anything along these lines?