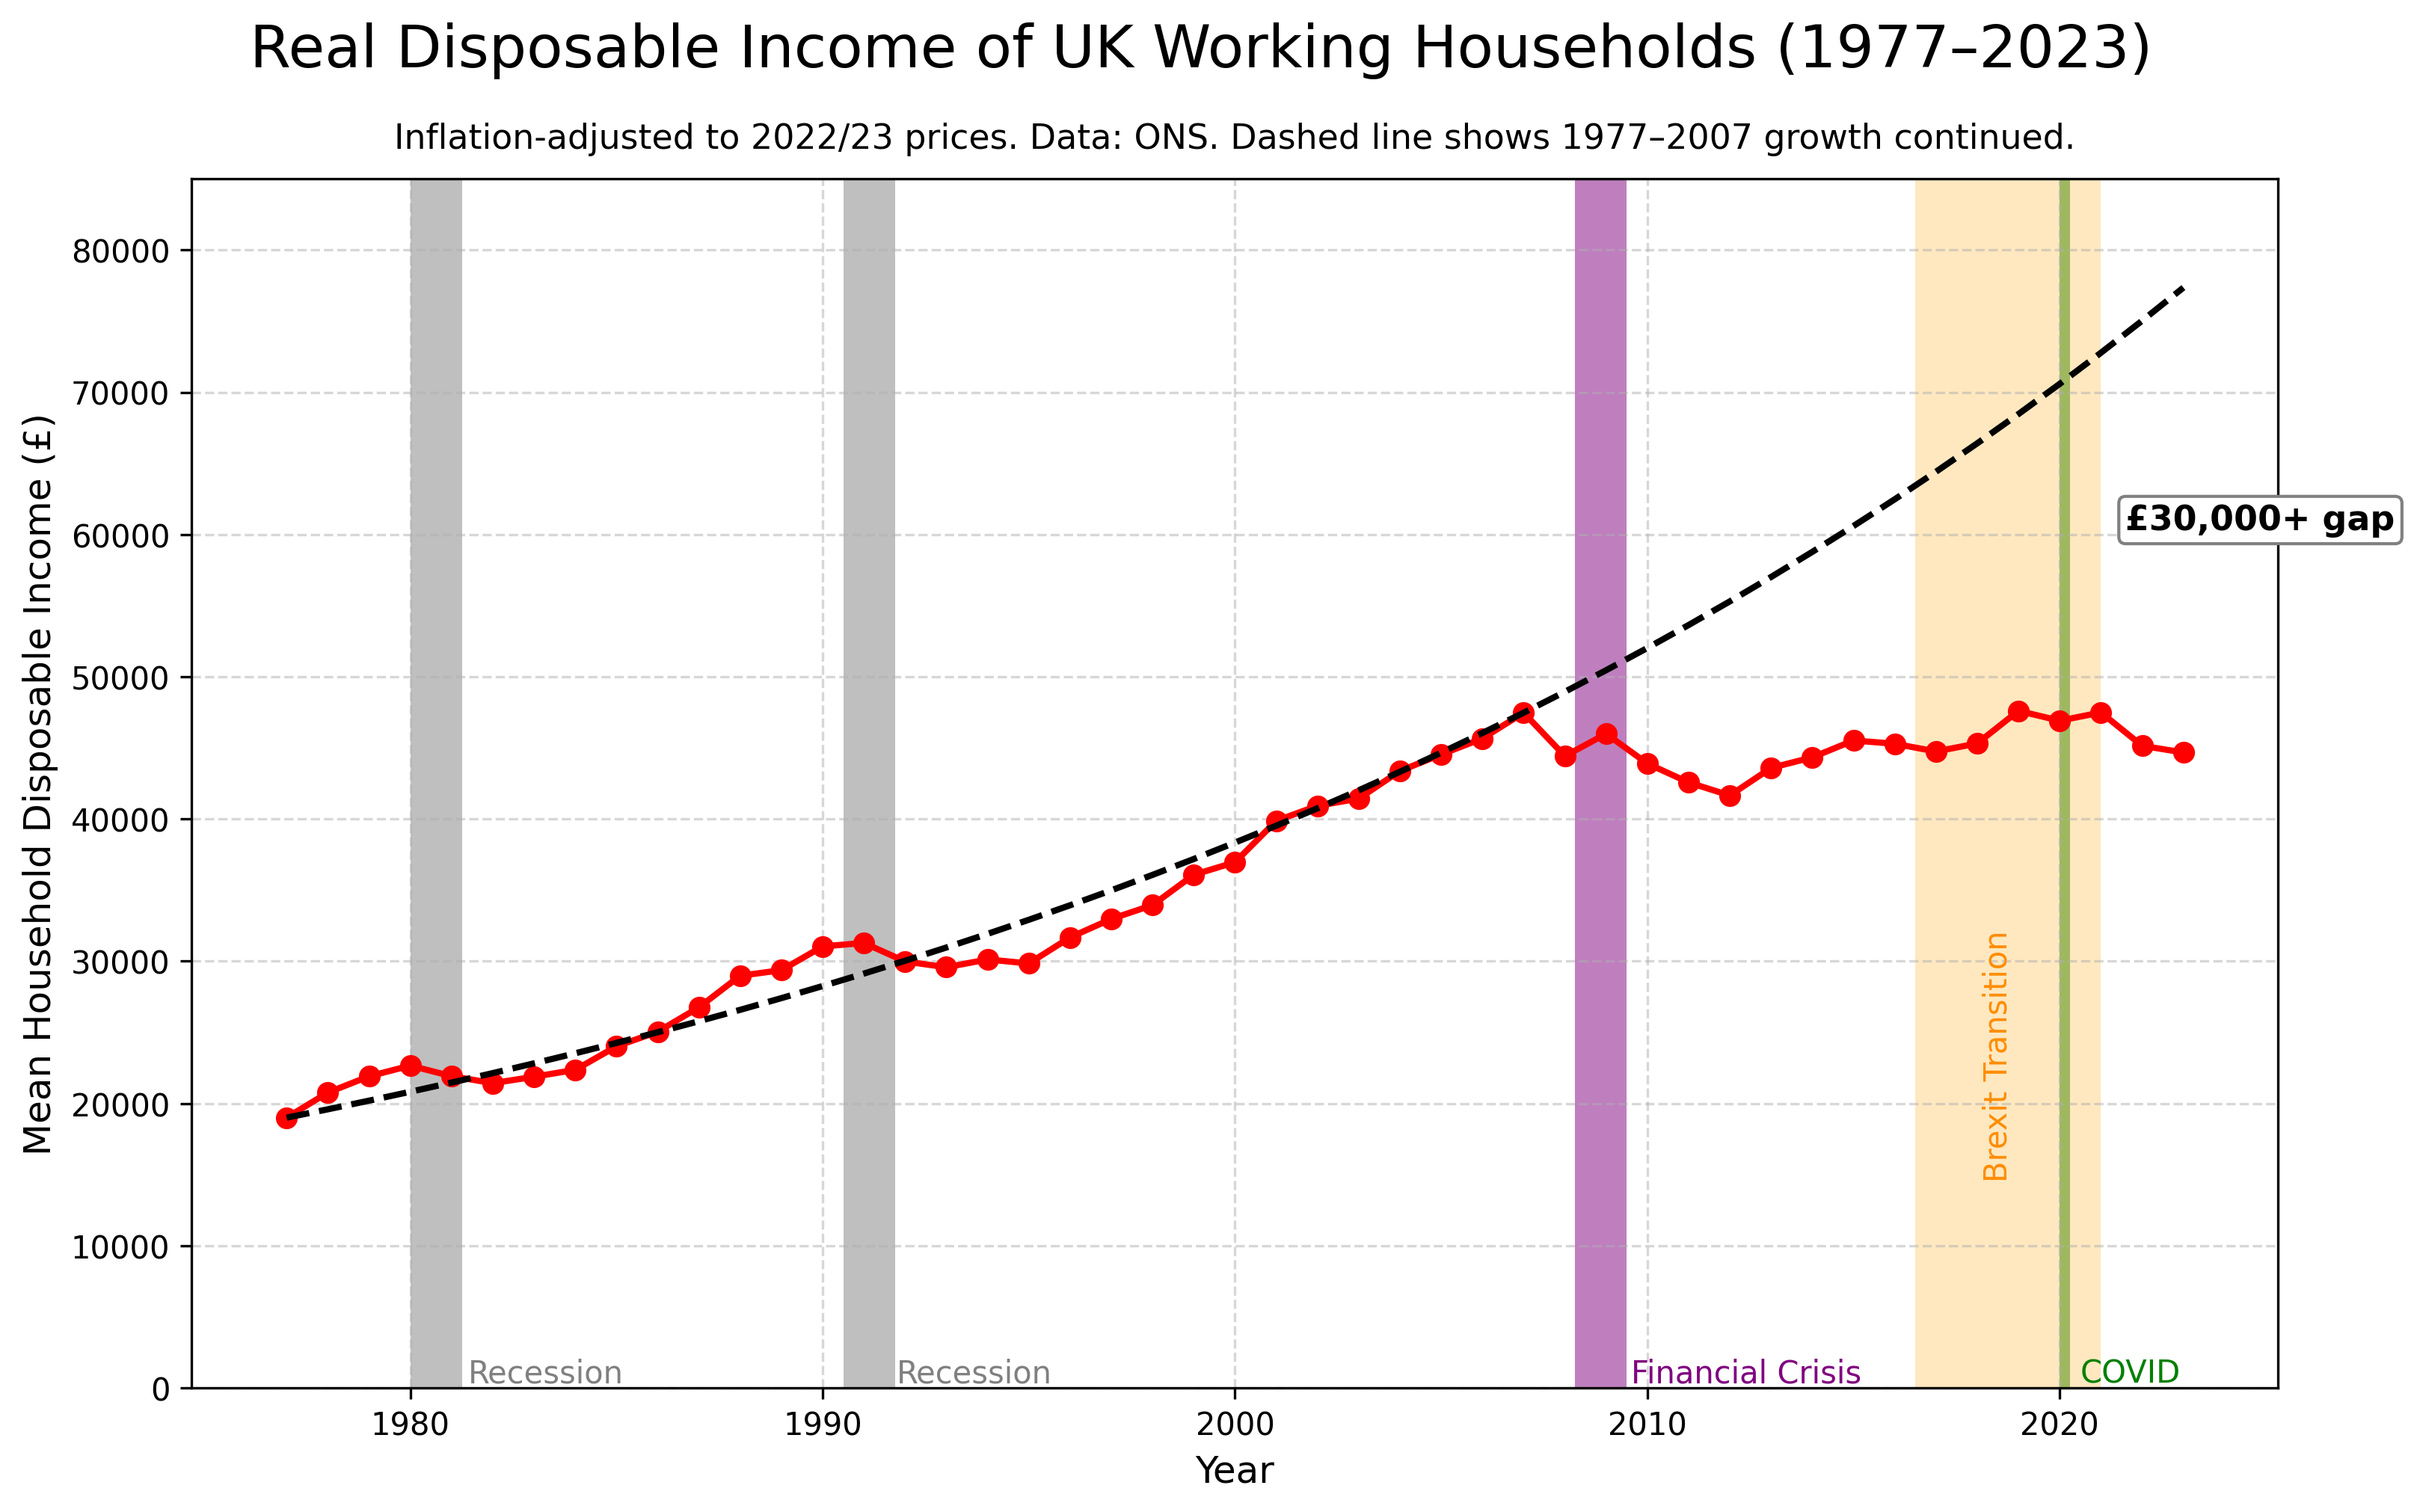
[OC] UK working households are now over £30,000 worse off than if pre-2008 income growth had continued.
Posted by cavedave

![[OC] UK working households are now over £30,000 worse off than if pre-2008 income growth had continued.](https://www.byteseu.com/wp-content/uploads/2025/05/7cme66i2vz0f1-1536x961.png "[OC] UK working households are now over £30,000 worse off than if pre-2008 income growth had continued.")
[OC] UK working households are now over £30,000 worse off than if pre-2008 income growth had continued.
Posted by cavedave
11 Comments
People in the UK are now very poor now compared to the trend it was on before the Financial Crises.
This is disposable income which is income after tax and after social welfare payments.
‘disposable income measure, which is the amount of money households have available for spending and saving after direct taxes have been accounted for. It includes earnings from employment, private pensions and investments as well as cash benefits provided by the state.’ [https://www.ons.gov.uk/peoplepopulationandcommunity/personalandhouseholdfinances/incomeandwealth/bulletins/householddisposableincomeandinequality/financialyearending2022](https://www.ons.gov.uk/peoplepopulationandcommunity/personalandhouseholdfinances/incomeandwealth/bulletins/householddisposableincomeandinequality/financialyearending2022)
Data from ons
[https://www.ons.gov.uk/peoplepopulationandcommunity/personalandhouseholdfinances/incomeandwealth/datasets/householddisposableincomeandinequality](https://www.ons.gov.uk/peoplepopulationandcommunity/personalandhouseholdfinances/incomeandwealth/datasets/householddisposableincomeandinequality) 2023 data was released 02 May 2025
Python matplotlib code up at
[https://gist.github.com/cavedave/1083d866f78760b036263a98cb68c1dc](https://gist.github.com/cavedave/1083d866f78760b036263a98cb68c1dc)
Wow that’s a huge loss in income. I wonder what part of this has to do with income stagnation and housing. Though this is for the entirety of the UK. I wonder how job opportunities influence these outcomes.
14 years of the conservatives in charge and they lowered the mean disposable income lol. I will forever rue boomers for Brexit, reelecting them in 2019, and now for the surging reform.
On the bright side, we are currently the fastest growing economy in the G7. We will see how it lasts post trump tariffs, but the recent trade deals with the US and India are likely to at least help soften the blow and give businesses confidence. We will also have to see what impact the budget has. But I’m hopeful that things might be on the up, for a couple years at least.
Thanks, bankers and Tories (but I repeat myself).
Don’t many other countries also look like this?
[removed]
Here is a similar, but not totally equivalent measure for the United States: [real disposable personal income per capita, and the 1977 to 2007 linear trend line](https://fred.stlouisfed.org/graph/?g=1J4jr), in 2017 dollars
Wages have remained roughly 2009 level while CoL has increased. That’s really really bad. We’re gonna see social unrest over this and it’s justified.
Feels like austerity was a mistake. Fiscal responsibility is one thing but not taking advantage of interest rates at basically 0% is another.
Yes.. if the unsustainable bubble never corrected, everyone would be rich…
Yeah I’m gonna get flack for this but a linear trend line would actually fit much better. Trend lines are a huge way to introduce bias into a graphic