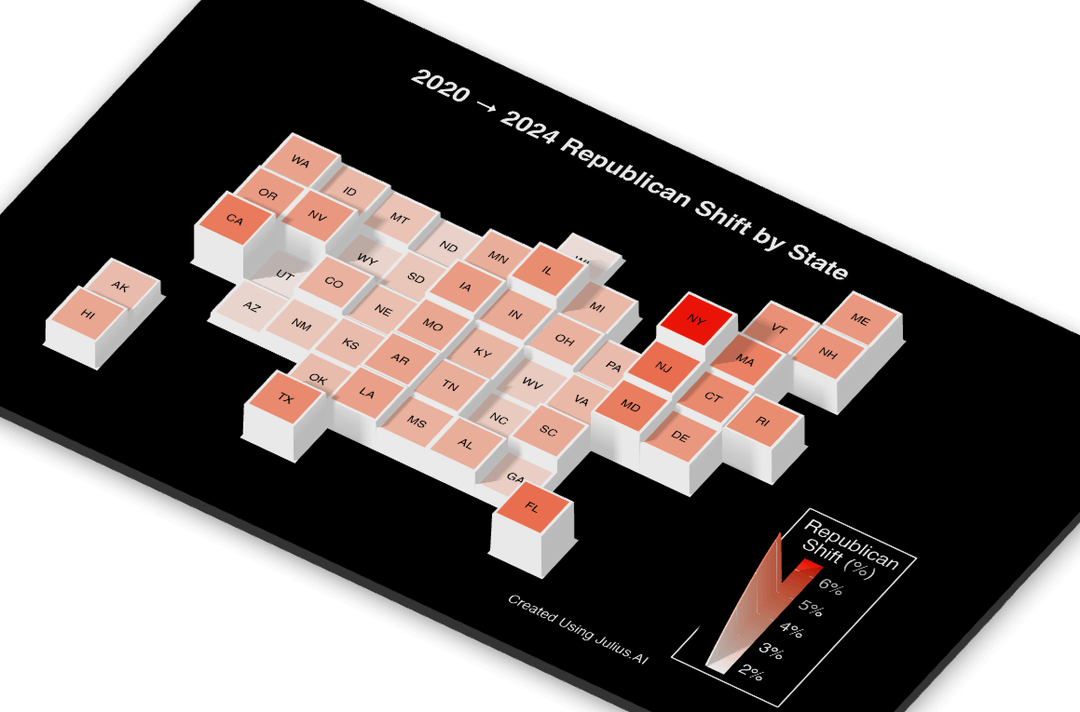
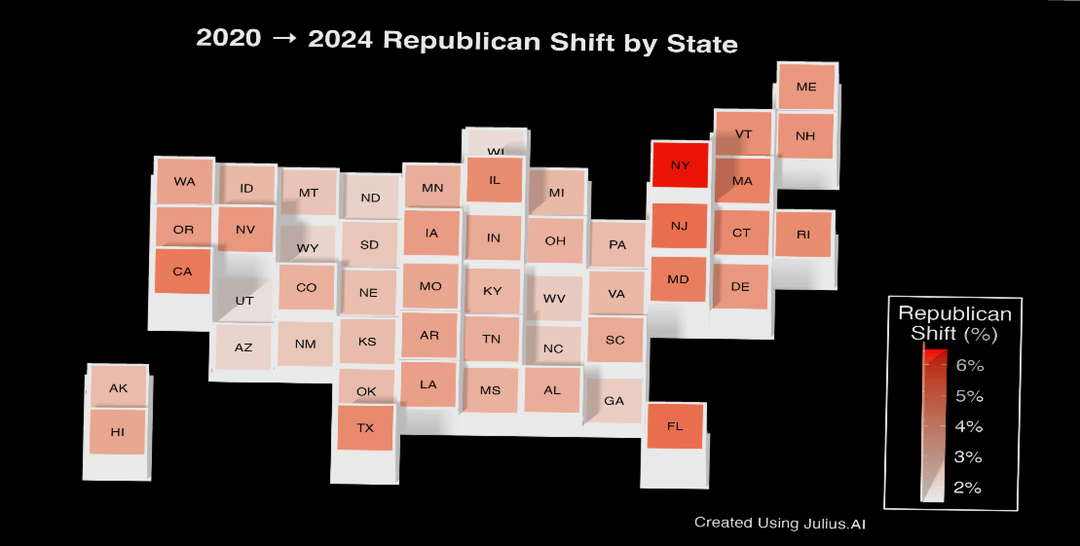
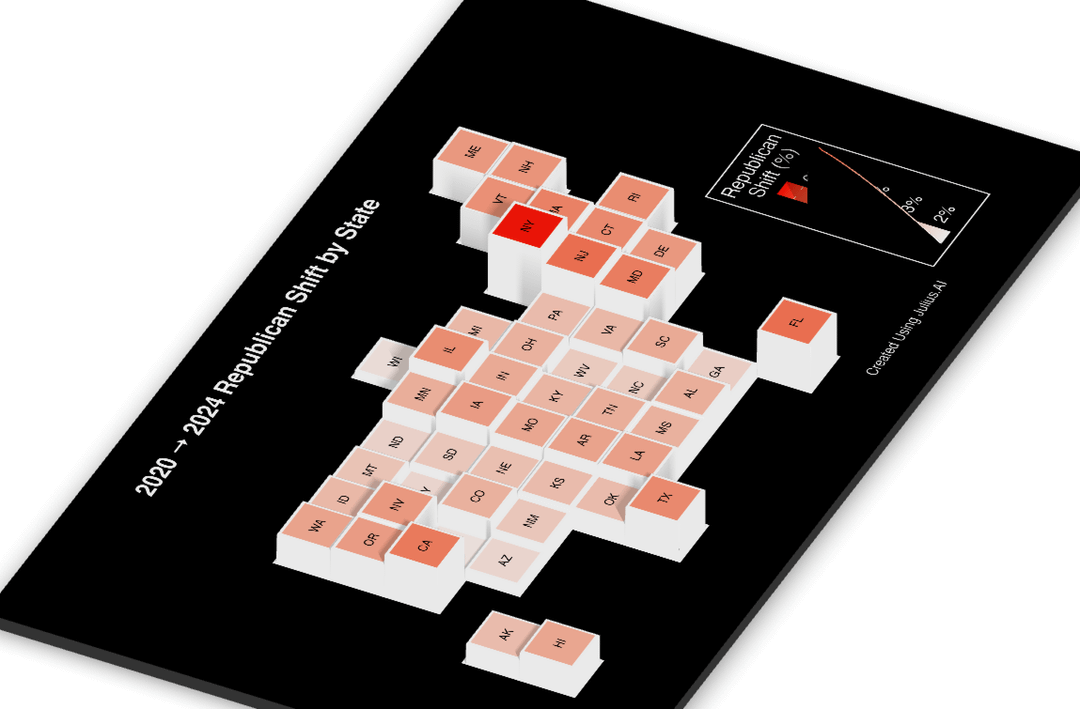
[OC] Trying out a new way (3D) to visualize rightward shift of 2024 Elections using R, rayshader and julius.ai. Feedback appreciated!
Posted by Ok-Commercial1594

![[OC] Trying out a new way (3D) to visualize rightward shift of 2024 Elections using R, rayshader and julius.ai. Feedback appreciated!](https://www.byteseu.com/wp-content/uploads/2025/06/qx8pab14y38f1-1024x675.png "[OC] Trying out a new way (3D) to visualize rightward shift of 2024 Elections using R, rayshader and julius.ai. Feedback appreciated!")
[OC] Trying out a new way (3D) to visualize rightward shift of 2024 Elections using R, rayshader and julius.ai. Feedback appreciated!
Posted by Ok-Commercial1594
6 Comments
Data Source – Wikipedia
Created using R, rayshader and [Julius.AI](http://Julius.AI)
[https://julius.ai/s/notebooks/afd397a3-7224-4f53-b9e8-b31895674bc7?utm_source=share&utm_campaign=notebooks&utm_medium=referral](https://julius.ai/s/notebooks/afd397a3-7224-4f53-b9e8-b31895674bc7?utm_source=share&utm_campaign=notebooks&utm_medium=referral)
My vote’s on the first one. Distinctive, beautiful and informative. Shouting out to Georgia.
How was the Republican Shift calculated?
Periodic Table of Republicants?
Is there a reason both height and color are used to depict the same variable?
I find it interesting that the biggest shifts seem to have occurred in the states with the highest percentages of immigrants.
https://en.wikipedia.org/wiki/List_of_U.S._states_and_territories_by_immigrant_population