I obtained my data from the General Social Survey (GSS) 2021, a reputable sociological survey conducted in the United States that collects data on demographic characteristics and attitudes of Americans. The GSS data is publicly accessible and was retrieved through the official GSS Data Explorer website (https://gssdataexplorer.norc.org).
To create my presentation, I used Keynote, a presentation software developed by Apple. I organized the information, charts, and visuals in Keynote to effectively communicate the findings from the GSS 2021 data.
Empmortakaten on
It would be interesting to see this broken down further such as along gender and age group.
snapphanen on
This data is not beautiful
bery20 on
This data would be more interesting if it included the race of the person answering the question
Magister_Hego_Damask on
It’s not writen anywhere where the data is from so i’m guessing we have another r/USdefaultism on our hands?
weaponized_seal on
this date would be more beautiful if the scale was appropiate, not to defend bogots but cmon the highest is 13 and it looks like its 100
polygonalopportunist on
This feels, quite informative
DefiantAbalone1 on
This data is surprising, especially when you contrast it with national voter demographics. Need more info re: the source, and the ethnicity of the participants.
E.g. here’s a google AI excerpt of voter demographics:
“Pew Research Center estimates that in 2022, 17% of Democratic voters were Black, non-Hispanic.
Another source, citing Pew Research, states that as of 2024, the share of Black voters within the Democratic coalition has remained fairly stable and currently makes up 18% of Democratic and Democratic-leaning voters.
The racial and ethnic composition of Democratic voters has become increasingly diverse, with over 40% identifying as Hispanic, Black, Asian, or other race.”
jdlech on
Huh. pet and houseplant is not on the list.
Wonder why?
Close_Rent_9800 on
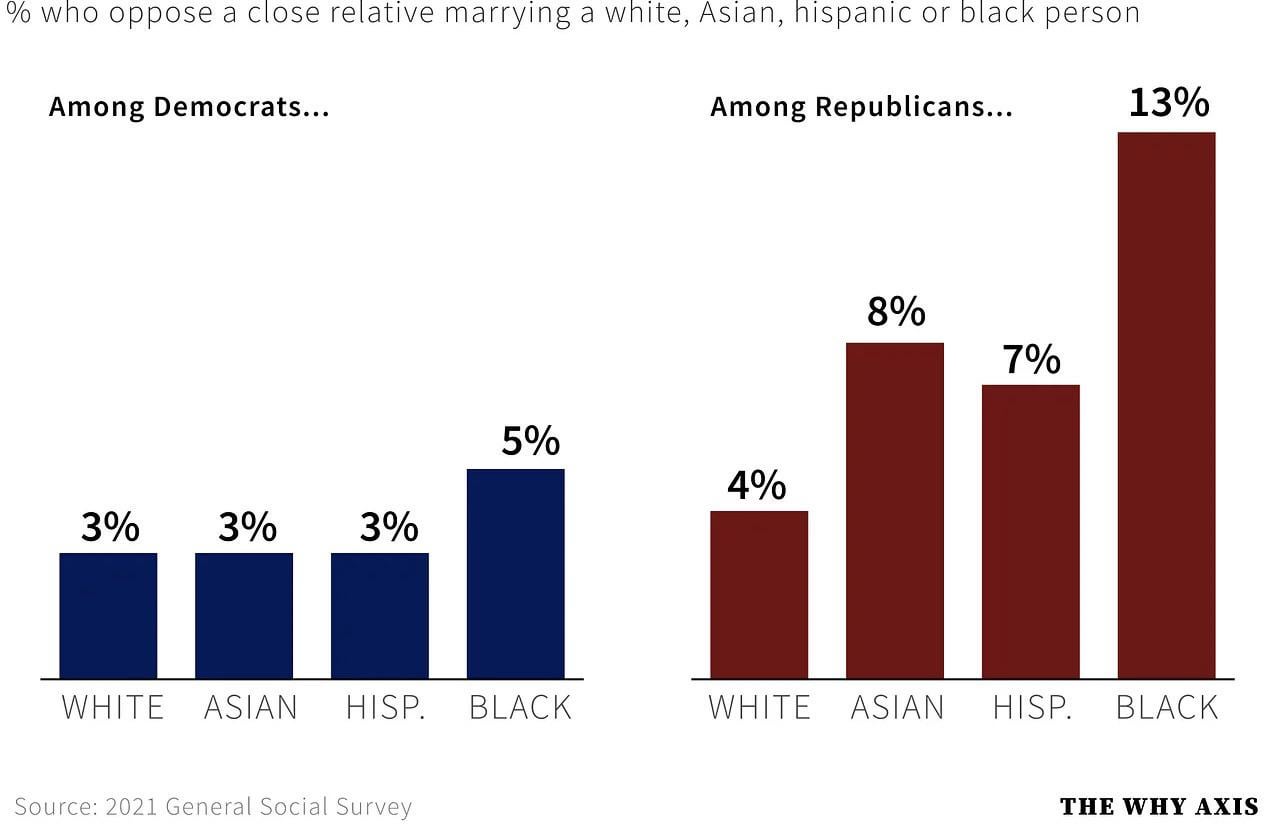
is there a recent why it’s so low or am i interpreting the graph incorrectly? This is the percentage of people against close relatives marrying.
badhombre44 on
This is data presentation designed to portray a significant difference when there really isn’t one. 5% vs 13%?
Loklokloka on
I’d be interested to see how these stats relate in regards to dating. I reckon they would be higher across the board. That sounds a little silly, but from my own (personal, and so obviously not universal) experience by the time of marriage alot of the people who felt this way have grown to really like the person and seen past differences. But with dating….
killians1978 on
Bro, either post the whole thing or don’t post it at all. What’s the survey size? Location? Ages?
This is the kind of graph that *feels* like it is accurate, because it confirms a limited observation, but the actual information here is less than useless.

![[OC] % Of People who would oppose a close relative marrying a ___](https://www.byteseu.com/wp-content/uploads/2025/06/ah0dg02sfj8f1-1024x665.jpeg "[OC] % Of People who would oppose a close relative marrying a ___")
14 Comments
I obtained my data from the General Social Survey (GSS) 2021, a reputable sociological survey conducted in the United States that collects data on demographic characteristics and attitudes of Americans. The GSS data is publicly accessible and was retrieved through the official GSS Data Explorer website (https://gssdataexplorer.norc.org).
To create my presentation, I used Keynote, a presentation software developed by Apple. I organized the information, charts, and visuals in Keynote to effectively communicate the findings from the GSS 2021 data.
It would be interesting to see this broken down further such as along gender and age group.
This data is not beautiful
This data would be more interesting if it included the race of the person answering the question
It’s not writen anywhere where the data is from so i’m guessing we have another r/USdefaultism on our hands?
this date would be more beautiful if the scale was appropiate, not to defend bogots but cmon the highest is 13 and it looks like its 100
This feels, quite informative
This data is surprising, especially when you contrast it with national voter demographics. Need more info re: the source, and the ethnicity of the participants.
E.g. here’s a google AI excerpt of voter demographics:
“Pew Research Center estimates that in 2022, 17% of Democratic voters were Black, non-Hispanic.
Another source, citing Pew Research, states that as of 2024, the share of Black voters within the Democratic coalition has remained fairly stable and currently makes up 18% of Democratic and Democratic-leaning voters.
The racial and ethnic composition of Democratic voters has become increasingly diverse, with over 40% identifying as Hispanic, Black, Asian, or other race.”
Huh. pet and houseplant is not on the list.
Wonder why?
is there a recent why it’s so low or am i interpreting the graph incorrectly? This is the percentage of people against close relatives marrying.
This is data presentation designed to portray a significant difference when there really isn’t one. 5% vs 13%?
I’d be interested to see how these stats relate in regards to dating. I reckon they would be higher across the board. That sounds a little silly, but from my own (personal, and so obviously not universal) experience by the time of marriage alot of the people who felt this way have grown to really like the person and seen past differences. But with dating….
Bro, either post the whole thing or don’t post it at all. What’s the survey size? Location? Ages?
This is the kind of graph that *feels* like it is accurate, because it confirms a limited observation, but the actual information here is less than useless.
**Source: 2021 General Social Survey**
lol sounds credible