

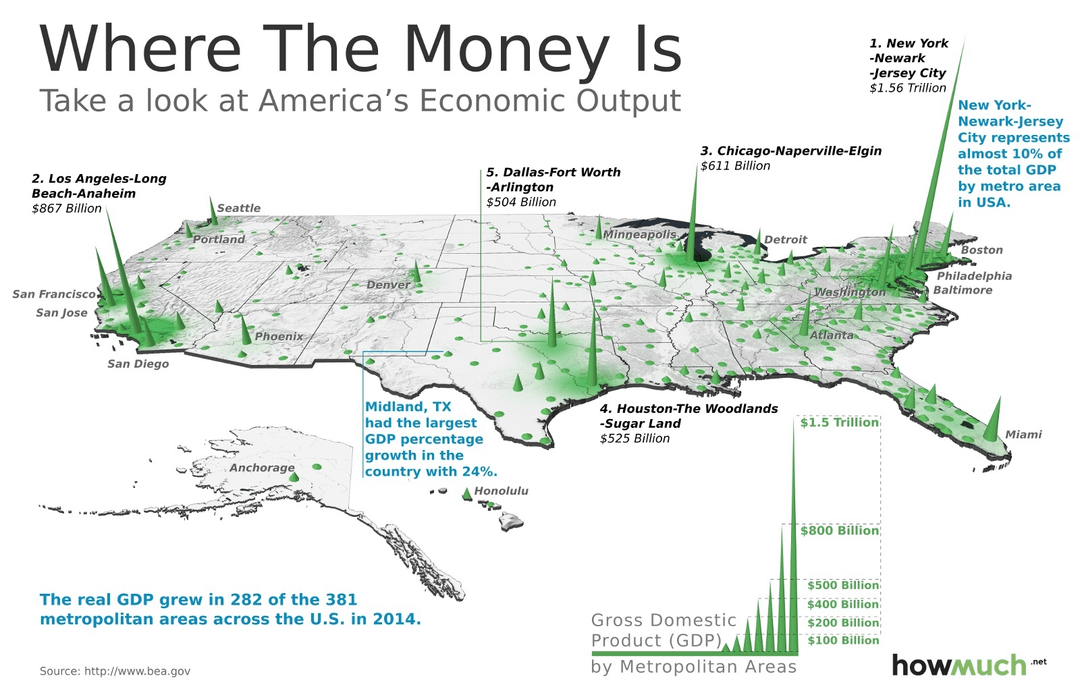
The largest metropolitan areas contributed the greatest amount of GDP for the country.
the top 20 metropolitan areas contributed over half of the United State’s GDP. The New York metropolitan area contributed nearly 10% to the GDP by itself. In terms of a breakdown by state, the top 5 states contributed around 40% of the entire country’s GDP. California alone contributed over 13% of the total GDP for the country.
Source-https://howmuch.net/articles/where-the-money-is-by-metro-area https://www.visualcapitalist.com/3d-map-the-u-s-cities-with-the-highest-economic-output/
Posted by Little-Spray-761
25 Comments
This isn’t really new. And it’s not really used because it’s not really informative.
I’d love to see the (GDP – Taxes In) per location.
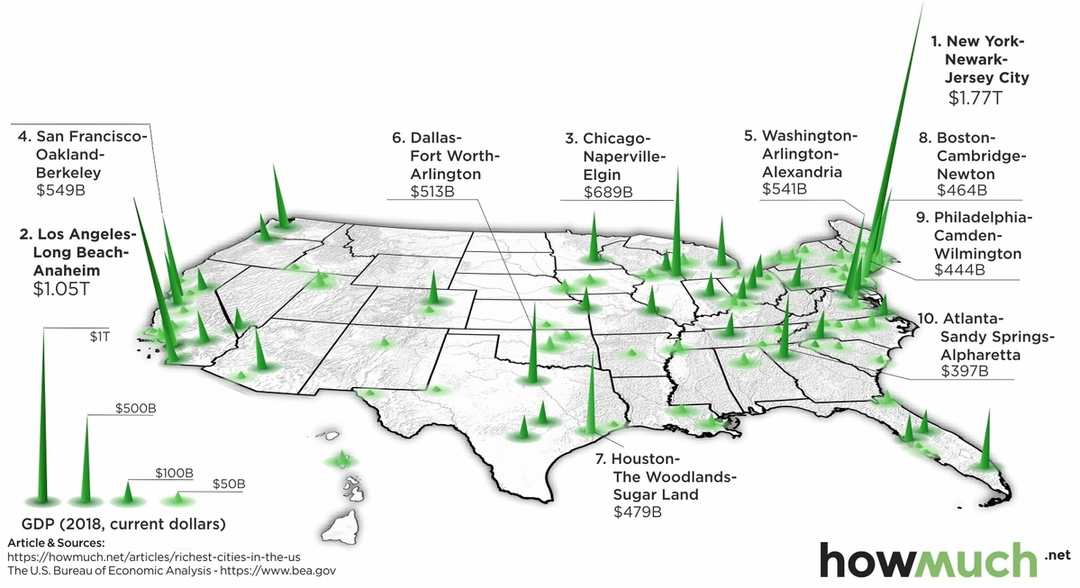
Is the 2018 map less detailed or does there a huge consolidation of wealth out of smaller cities from 2014 to 2018?
I’m unclear if a large GDP just means that housing, education and medical care cost a lot.
It’s a population map? That a state with 12% of the population is responsible for 13% of the GDP isn’t a super interesting result. The top five states contributed 40% — not super surprising, because 37% of the population lives in them.
Florida is exploding… growing up we had no economy here at all. The change has been crazy to see in person.
People live in cities, corporations are headquartered in cities.
Seems like the economy decided New York should cosplay as the Eiffel Tower.
chicago always surprises me for how important it is economically and how irrelevant it is culturally, at least in the past few decades
Now turn it red and blue. That would be even more interesting.
This would be more interesting if normalised for population as well. If the 40% of population living in a met area are producing more than 40% of the economy then it’s an interesting spike
Big cities have all the money, more news at 8.
This doesn’t translate well when trying to figure out how much you get paid as well as cost of living
GDP is a measure of money exchanged rather than how much goes into the residents’ pockets. This means a tremendous amount~vast majority of money will never be redirected to the general public in wages and will just be had in trade and other deals
Man the Mountain West ain’t doing shit for the economy.
Can someone explain the difference between the two maps ? There are multiple labels and headings – I can’t figure it out. Thanks
This is also pretty dated data- the map was published in 2020, and the data is from 2018.
I feel Raleigh/Durham NC should have been combined here. It’s not a borderless metroplex, but given the intertwined commutes, and shared ownership of Research Triangle Park in middle, it’s not unreasonable.
what are the big industries in Florida? is it agriculture and importing? I don’t think of it as a tech hub or big in manufacturing.
Economic output is a misnomer for New York. With their GDP led by “Finance and Insurance, Real Estate and Rental and Leasing, and Professional and Business Services”, they’re really just the parasite living off of states that actually produce things.
What exactly is “new” about this?
Money-wise, the Midland-Odessa area is interesting as it’s oil price dependent, especially Midland’s sister city Odessa with the “blue collars” types.
What does 3D add that a smart color palette wouldn’t 😭
where is the “this is worthless” meme
this needs it
Why not share that it’s from the last decade in the title?
There was a similar visualization I saw a while back that showed the negative output as well (public debt? Money inflow but not outflow?) which demonstrated just how much high-density mixed-zone cities were subsidizing suburbs, and even poor neighbourhoods.