I used python to build the data set for this chart after downloading the 2024 data file for the IEA World Energy Investment 2024 report. I then use PlotSet to build and interactive data visualisation of the level of investment in Nuclear Energy, split by regions so that I could see the story behind the data. This is a snapshot of the chart. When you run your mouse over the version I created in PlotSet, you can explore the underlying data.
thinking_makes_owww on
Lemme guess vast majority of europe is france keeping their fleet up?

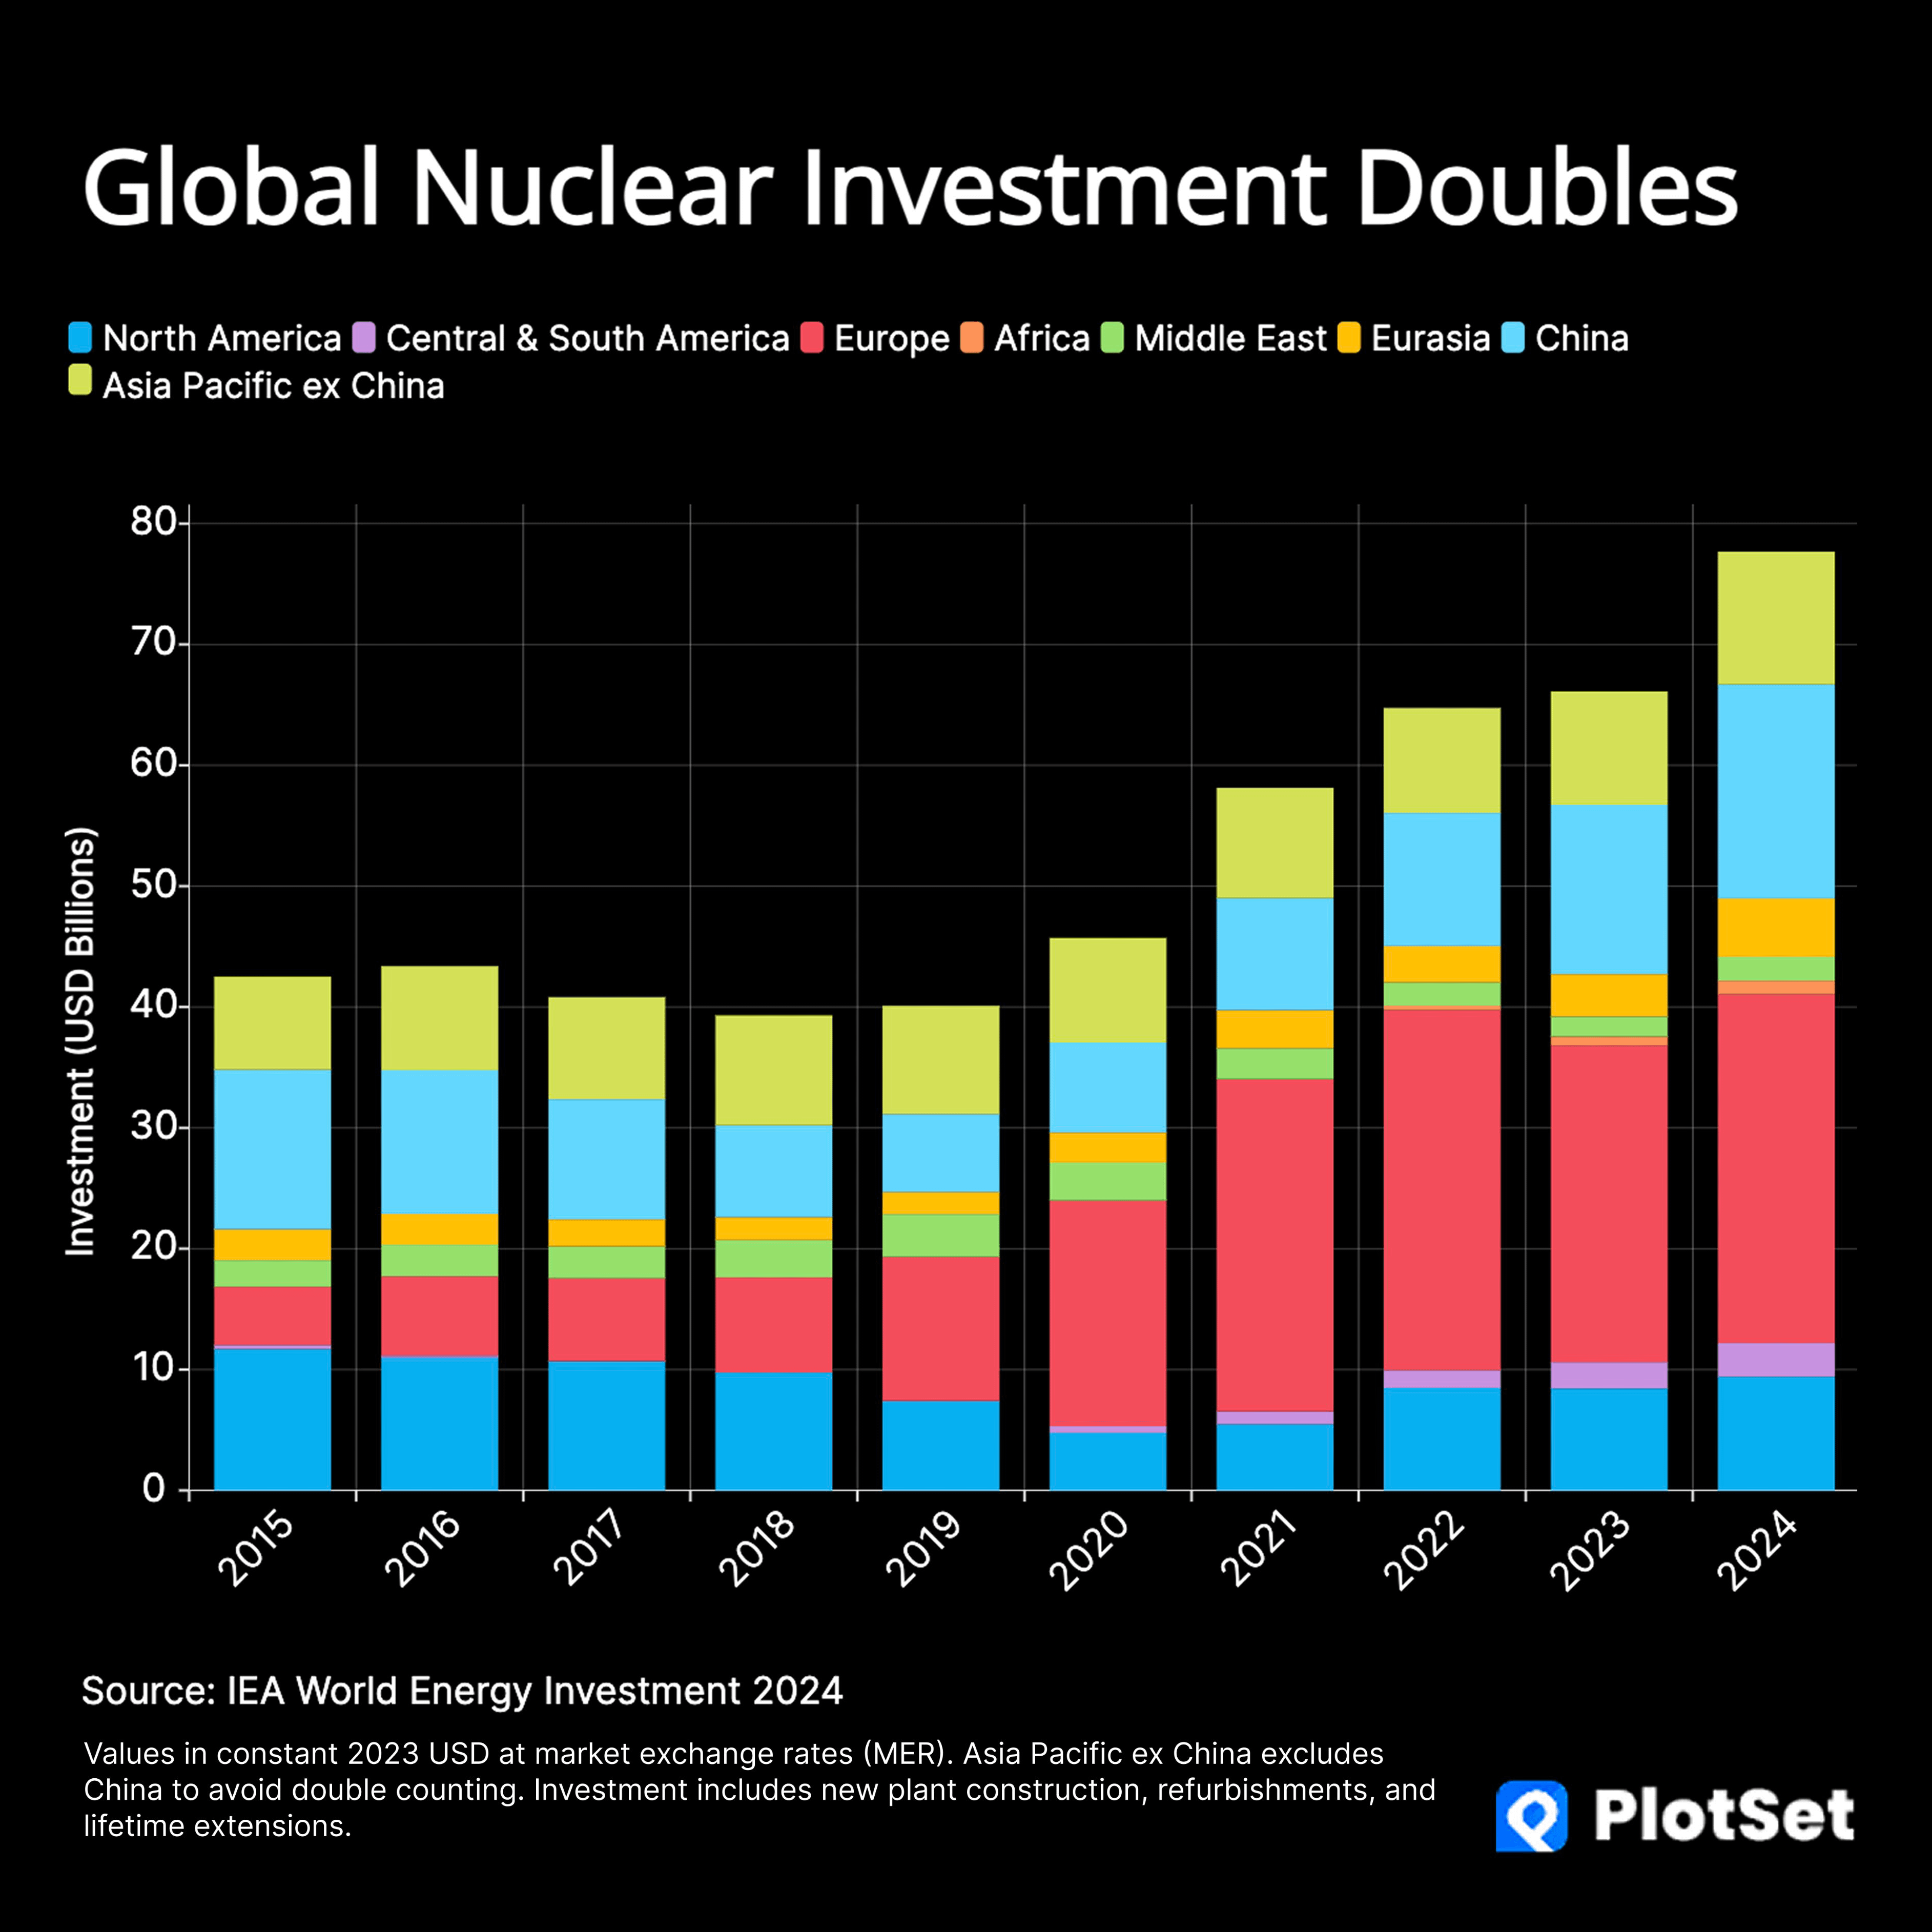
![[OC] Global Nuclear Investment Over Time](https://www.byteseu.com/wp-content/uploads/2025/07/sy38z47x38af1-1536x1536.png "[OC] Global Nuclear Investment Over Time")
2 Comments
I used python to build the data set for this chart after downloading the 2024 data file for the IEA World Energy Investment 2024 report. I then use PlotSet to build and interactive data visualisation of the level of investment in Nuclear Energy, split by regions so that I could see the story behind the data. This is a snapshot of the chart. When you run your mouse over the version I created in PlotSet, you can explore the underlying data.
Lemme guess vast majority of europe is france keeping their fleet up?