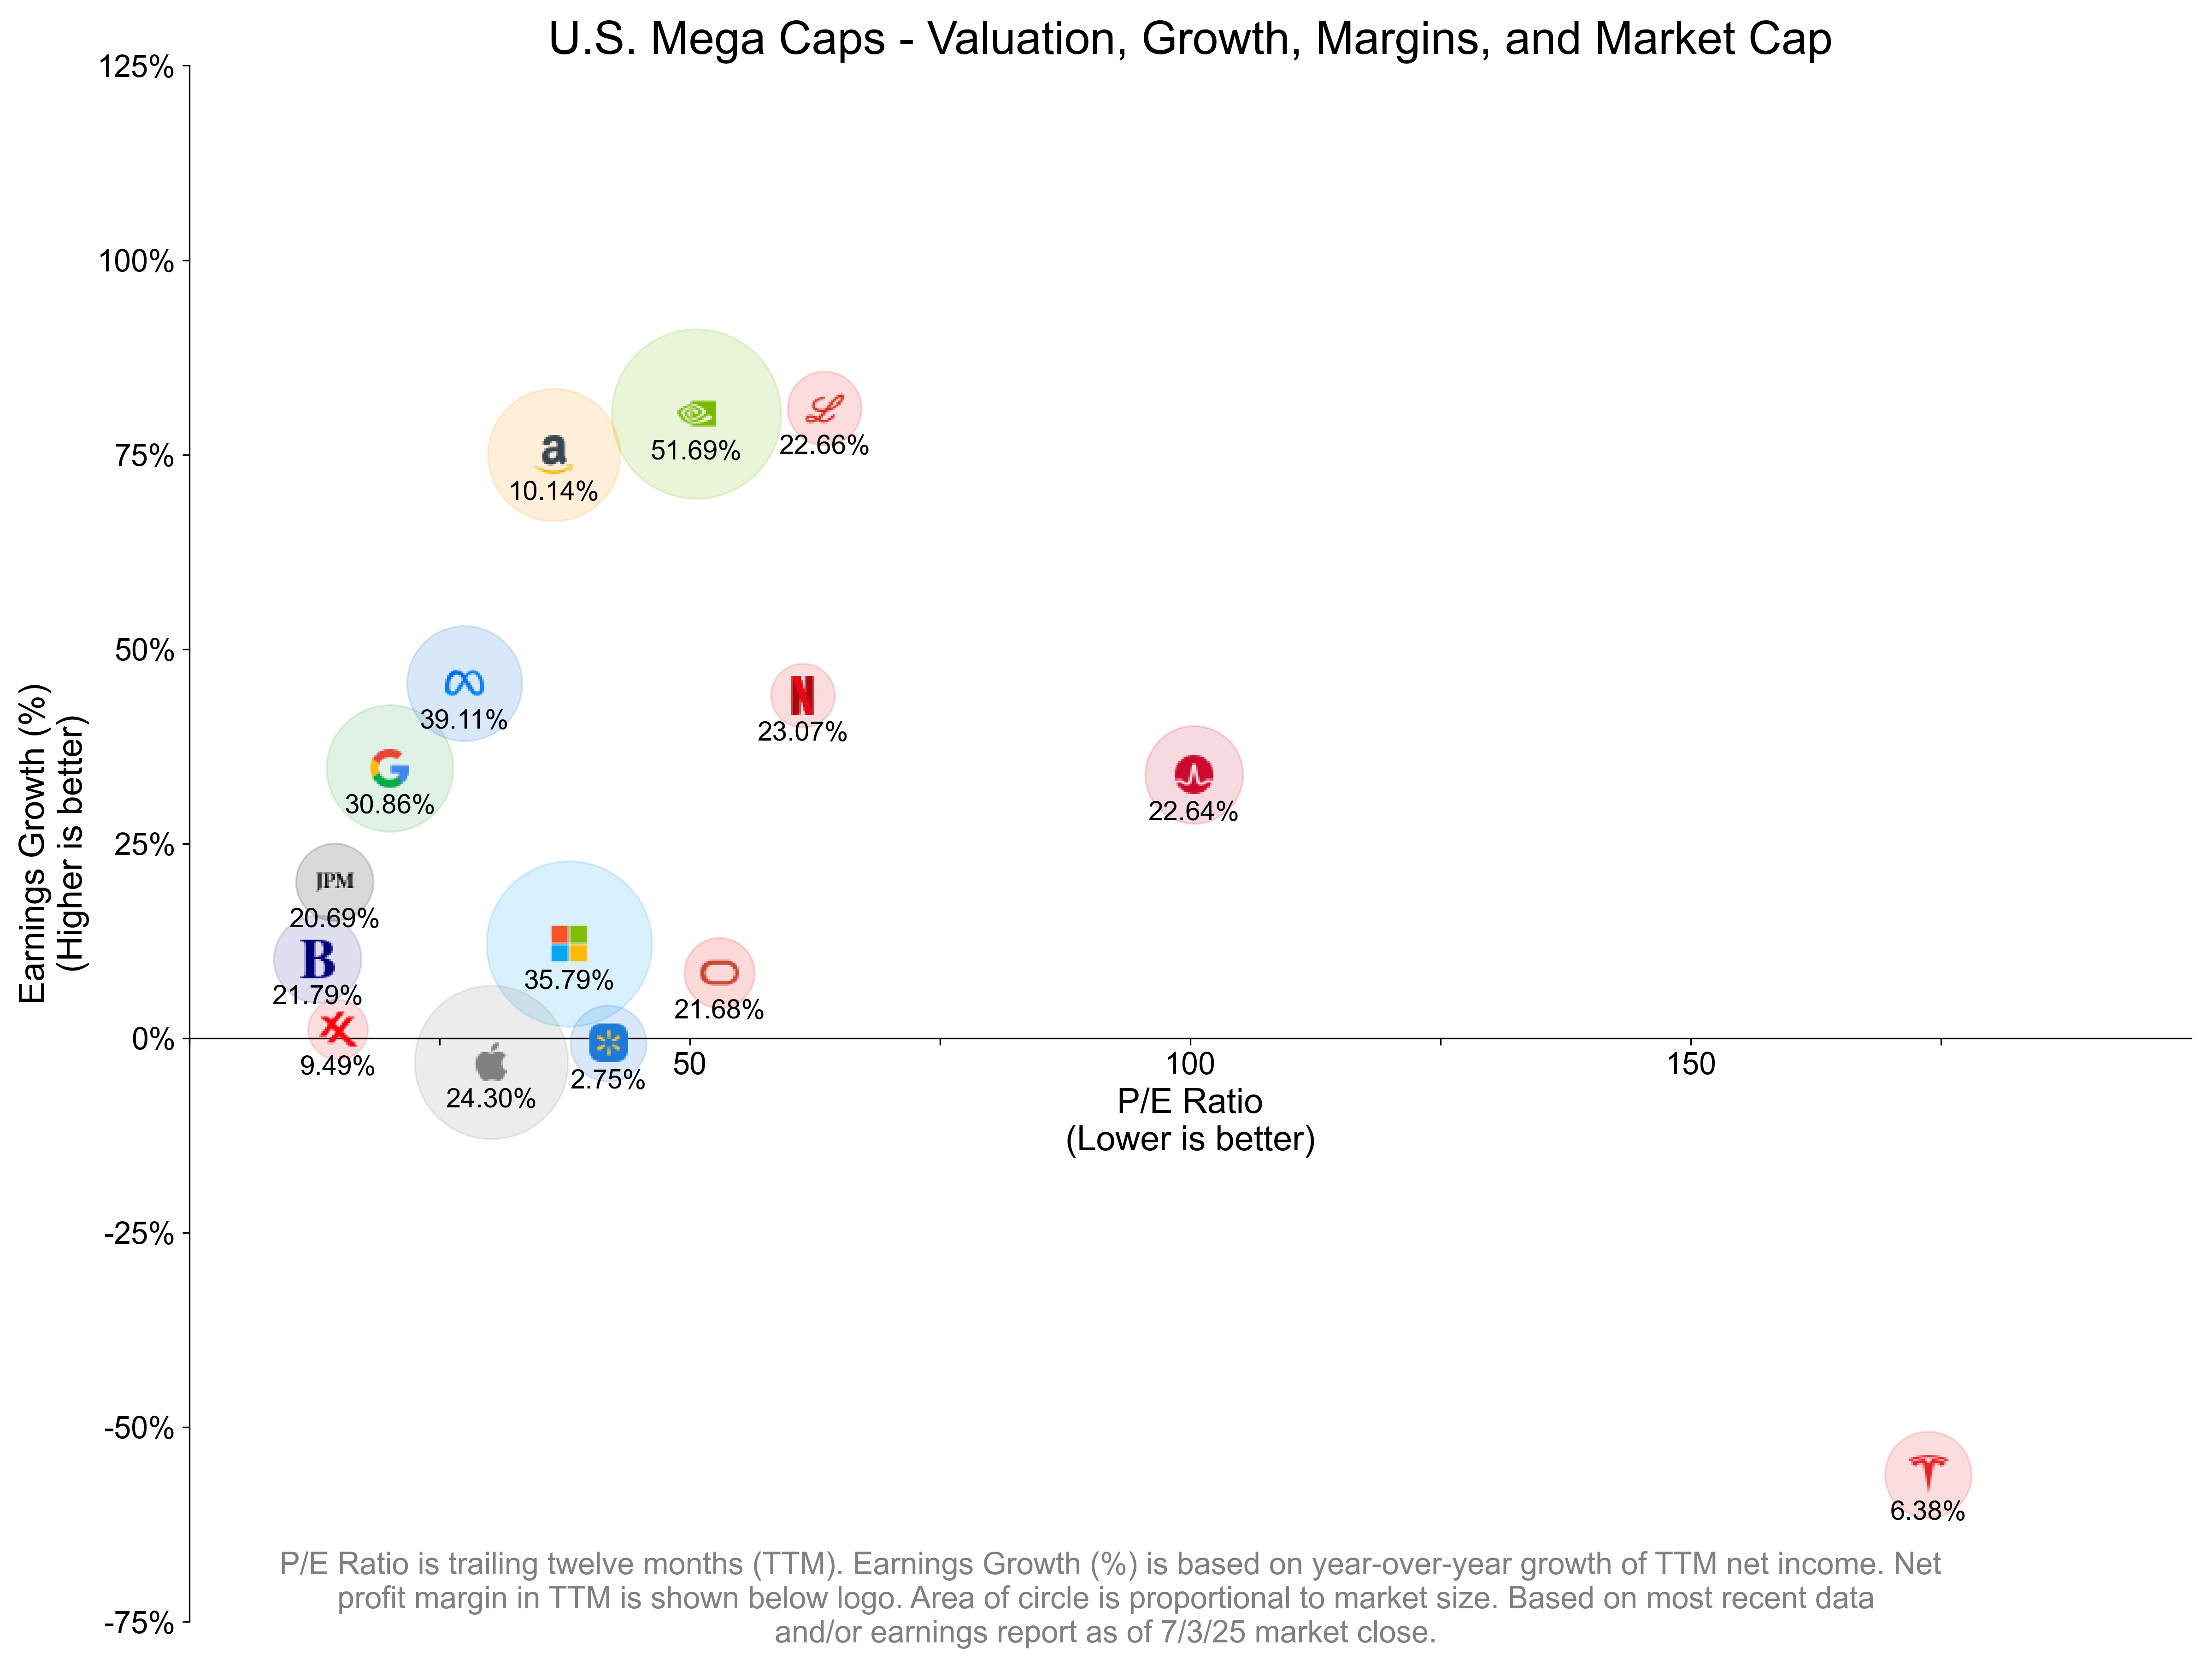
This is an updated of an [older plot](https://www.reddit.com/r/dataisbeautiful/comments/1ijdqts/oc_magnificent_7_valuation_growth_and_margins/) I made depicting the valuation, growth, and margins for the Magnificent 7. Based on feedback from the last go-around, I’m depicting each company with a consistent logo size so that they can be easily visualized, since with the previous depiction, outliers such as Tesla were easy to miss. Instead, the area of the surrounding circle will be proportional to the company’s market cap. Net profit margins are annotated below the logos.
Additionally, I decided to include all 18 companies with a market cap exceeding $400 billion. However, as it turns out, some of the data points would cause the graph to be too congested–as such, V, MA, and COST are excluded, but all the data are shown in the table below.
– Growth rate and net margin are obtained from Macrotrends for each company.
– P/E ratio and market cap are obtained using Microsoft Excel, as of 7/3/25 market close.
– Plot was generated using Python Matplotlib.
peters-mith on
Do we need any more proof that Tesla is a meme stock?!

![[OC] U.S. Mega Caps - Valuation, Growth, Margins, and Market Cap](https://www.byteseu.com/wp-content/uploads/2025/07/s3ydhq9v0taf1-1536x1152.png "[OC] U.S. Mega Caps – Valuation, Growth, Margins, and Market Cap")
3 Comments
This is an updated of an [older plot](https://www.reddit.com/r/dataisbeautiful/comments/1ijdqts/oc_magnificent_7_valuation_growth_and_margins/) I made depicting the valuation, growth, and margins for the Magnificent 7. Based on feedback from the last go-around, I’m depicting each company with a consistent logo size so that they can be easily visualized, since with the previous depiction, outliers such as Tesla were easy to miss. Instead, the area of the surrounding circle will be proportional to the company’s market cap. Net profit margins are annotated below the logos.
Additionally, I decided to include all 18 companies with a market cap exceeding $400 billion. However, as it turns out, some of the data points would cause the graph to be too congested–as such, V, MA, and COST are excluded, but all the data are shown in the table below.
| Ticker | P/E | Growth Rate | Net Margin | Market Cap (Billions) |
|:-|:-|:-|:-|:-|
| NVDA | 50.65 | 80.23% | 51.69% | $3,888 |
| MSFT | 37.95 | 12.13% | 35.79% | $3,708 |
| AAPL | 30.16 | -3.08% | 24.30% | $3,190 |
| AMZN | 36.44 | 74.99% | 10.14% | $2,372 |
| GOOG | 20.05 | 34.69% | 30.86% | $2,174 |
| META | 27.49 | 45.62% | 39.11% | $1,794 |
| AVGO | 100.36 | 33.85% | 22.64% | $1,294 |
| BRK.B | 12.81 | 10.18% | 21.79% | $1,036 |
| TSLA | 173.73 | -56.11% | 6.38% | $1,016 |
| JPM | 14.53 | 20.07% | 20.69% | $811 |
| WMT | 41.87 | -0.65% | 2.75% | $785 |
| LLY | 63.47 | 80.93% | 22.66% | $740 |
| V | 36.04 | 8.13% | 52.86% | $696 |
| ORCL | 52.97 | 8.38% | 21.68% | $667 |
| NFLX | 61.29 | 44.05% | 23.07% | $552 |
| MA | 39.92 | 10.96% | 45.21% | $517 |
| XOM | 14.86 | 1.14% | 9.49% | $484 |
| COST | 51.29 | 9.34% | 2.92% | $437 |
– Growth rate and net margin are obtained from Macrotrends for each company.
– P/E ratio and market cap are obtained using Microsoft Excel, as of 7/3/25 market close.
– Plot was generated using Python Matplotlib.
Do we need any more proof that Tesla is a meme stock?!
One of these things is not like the others
One of these things does not belong