Share Facebook Twitter LinkedIn Pinterest Bluesky Threads Data sources: Regional gross disposable household income, UK: 1997 to 2022 Consumer price inflation time series Tools used: Matplotlib Posted by oscarleo0
SXLightning on July 4, 2025 10:02 am Newham probably because of canary wharf? So many people live in Newham who works in CW
Scrapheaper on July 4, 2025 10:10 am Interesting! Do you have absolute as well as relative values? I imagine the base level in Kensington is not the same as it was it Hackney
Yuzral on July 4, 2025 10:19 am So is that those bits of London getting even richer or starting from a lower baseline and catching up?
AlphaSatsuma on July 4, 2025 11:24 am Interesting. I’d be interested to know the one that’s gone down and the one that’s flat over 25 years
woodzopwns on July 4, 2025 1:23 pm Now do it taking away average costs inflation adjusted too, such as rent
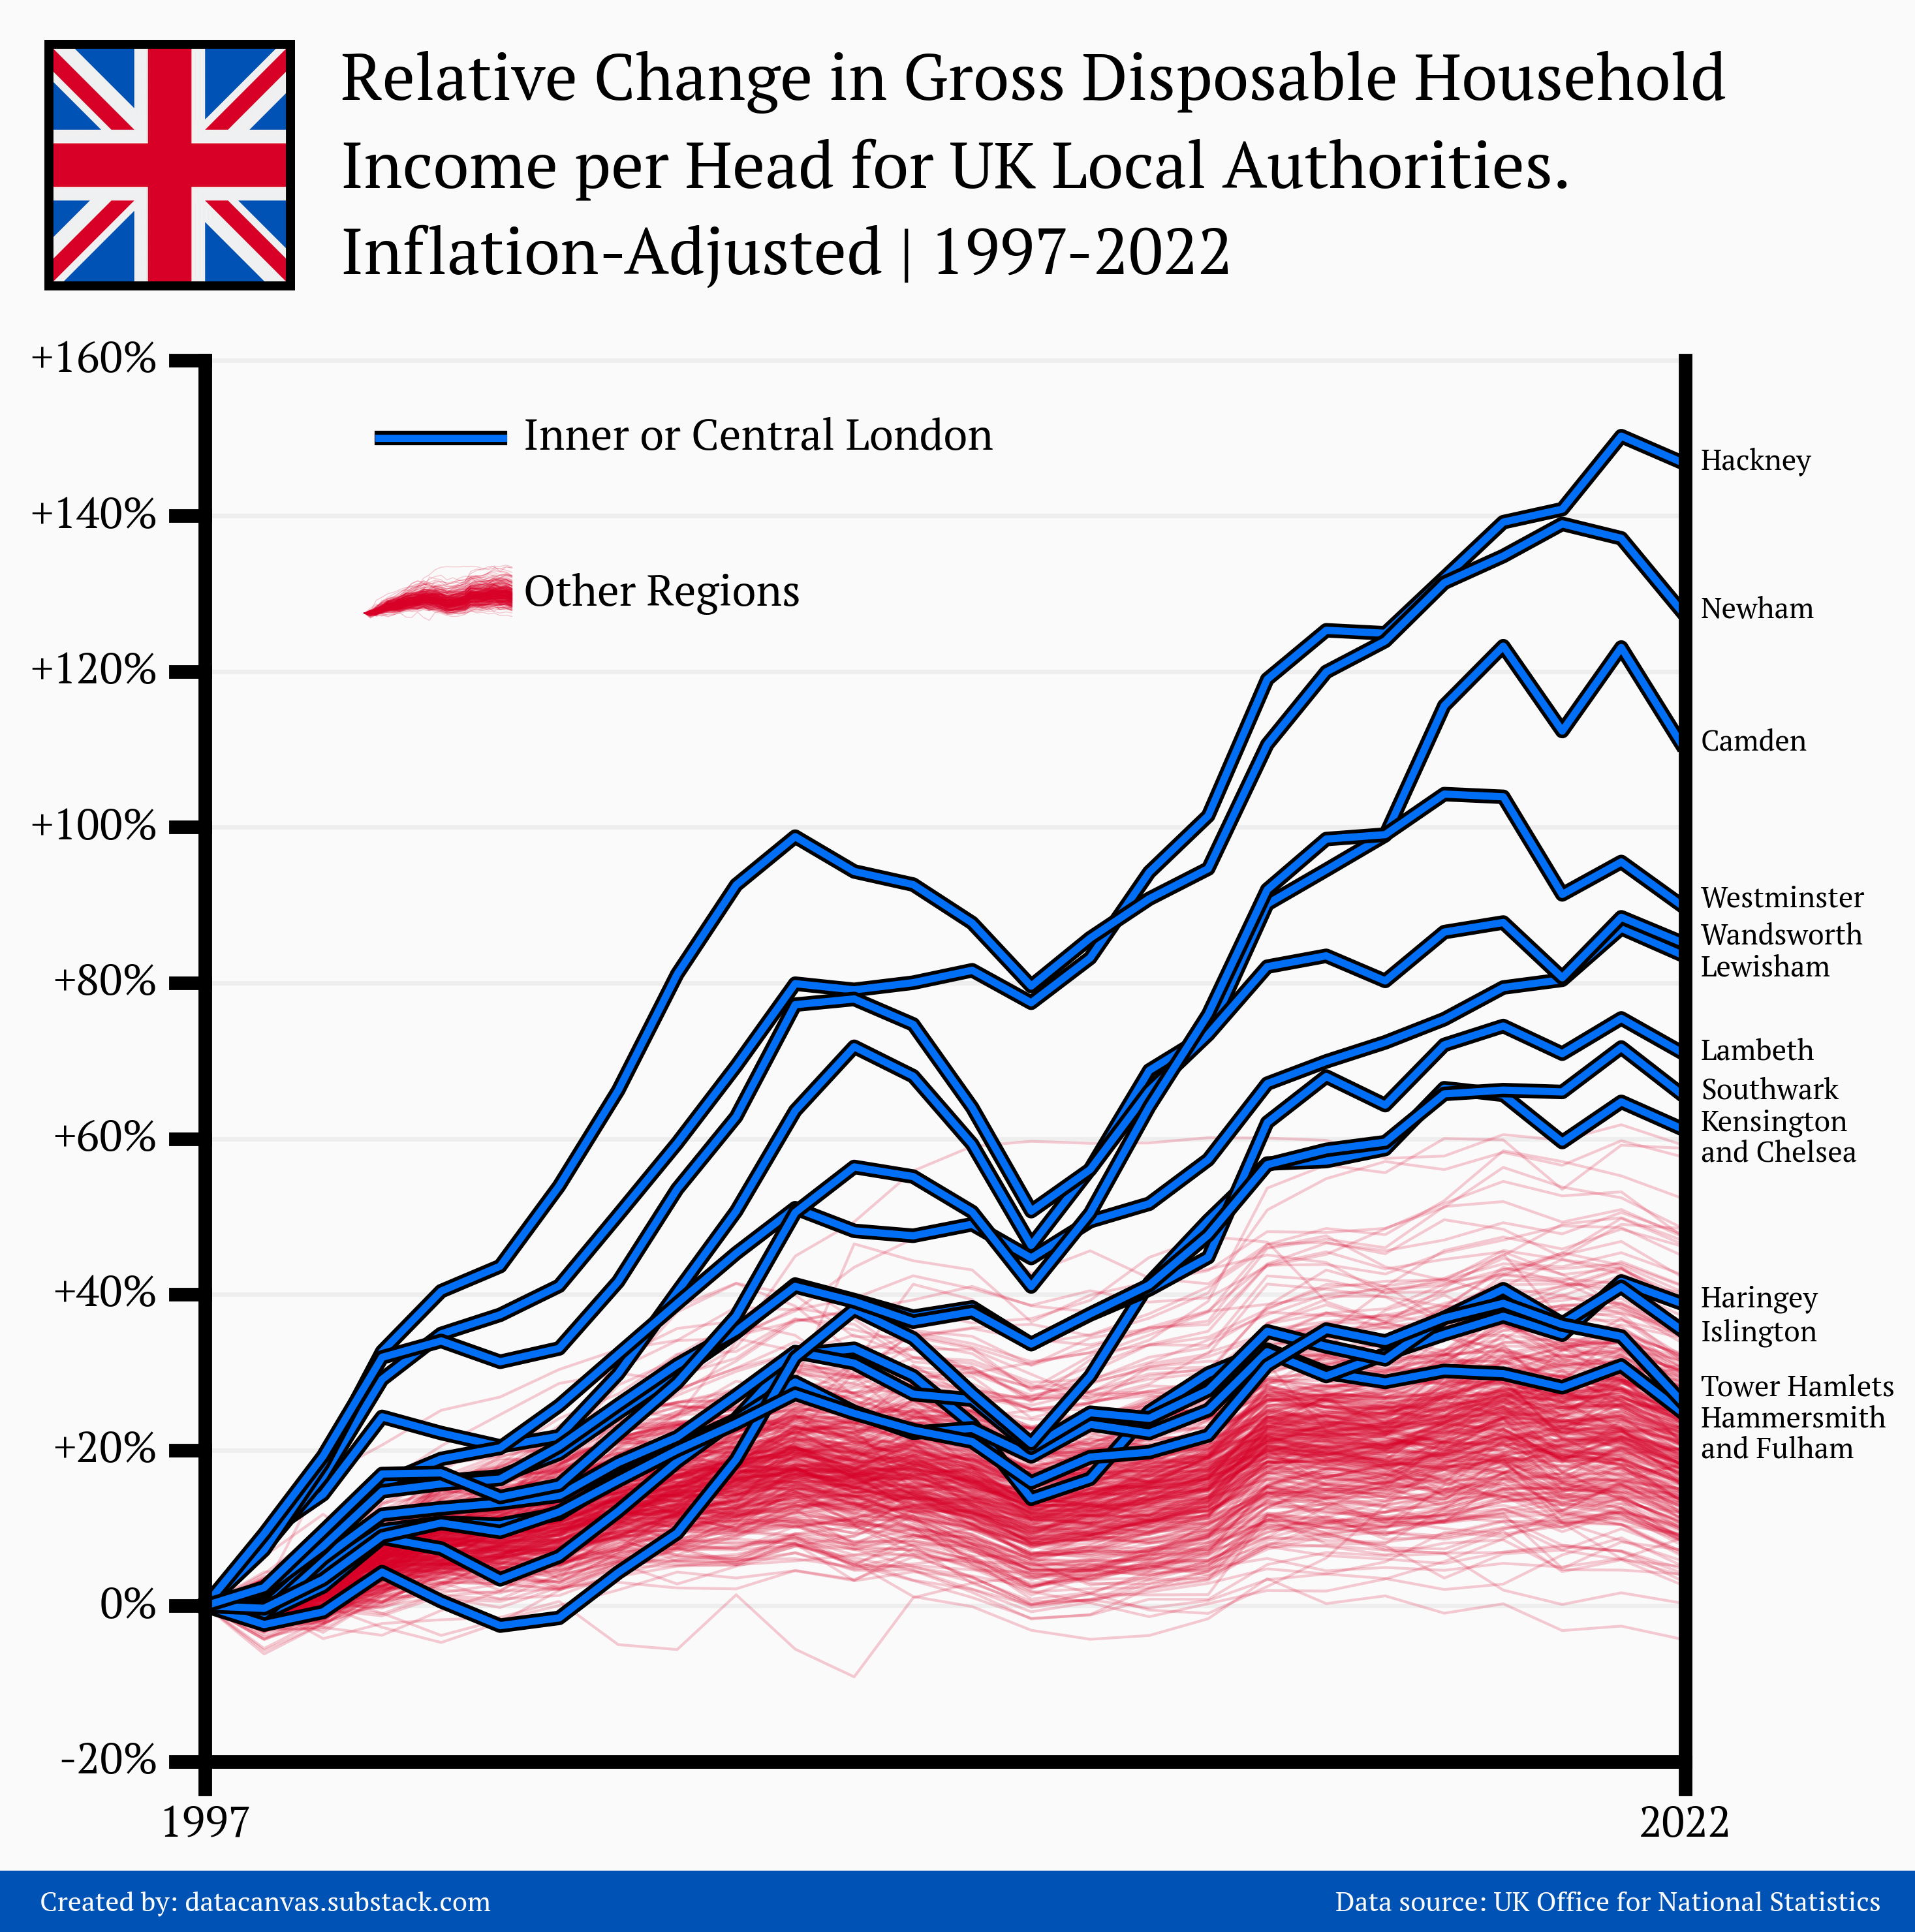

![[OC] Relative Change in Gross Disposable Household Income per Head for UK Local Authorities. Inflation-Adjusted | 1997-2022](https://www.byteseu.com/wp-content/uploads/2025/07/lqgbq7b1vtaf1-1523x1536.png "[OC] Relative Change in Gross Disposable Household Income per Head for UK Local Authorities. Inflation-Adjusted | 1997-2022")
5 Comments
Newham probably because of canary wharf? So many people live in Newham who works in CW
Interesting!
Do you have absolute as well as relative values? I imagine the base level in Kensington is not the same as it was it Hackney
So is that those bits of London getting even richer or starting from a lower baseline and catching up?
Interesting. I’d be interested to know the one that’s gone down and the one that’s flat over 25 years
Now do it taking away average costs inflation adjusted too, such as rent