
![Electric Vehicles to All Light Duty Vehicles by State [OC]](https://www.byteseu.com/wp-content/uploads/2025/07/00vasusosnbf1-1536x1187.jpeg "Electric Vehicles to All Light Duty Vehicles by State [OC]")
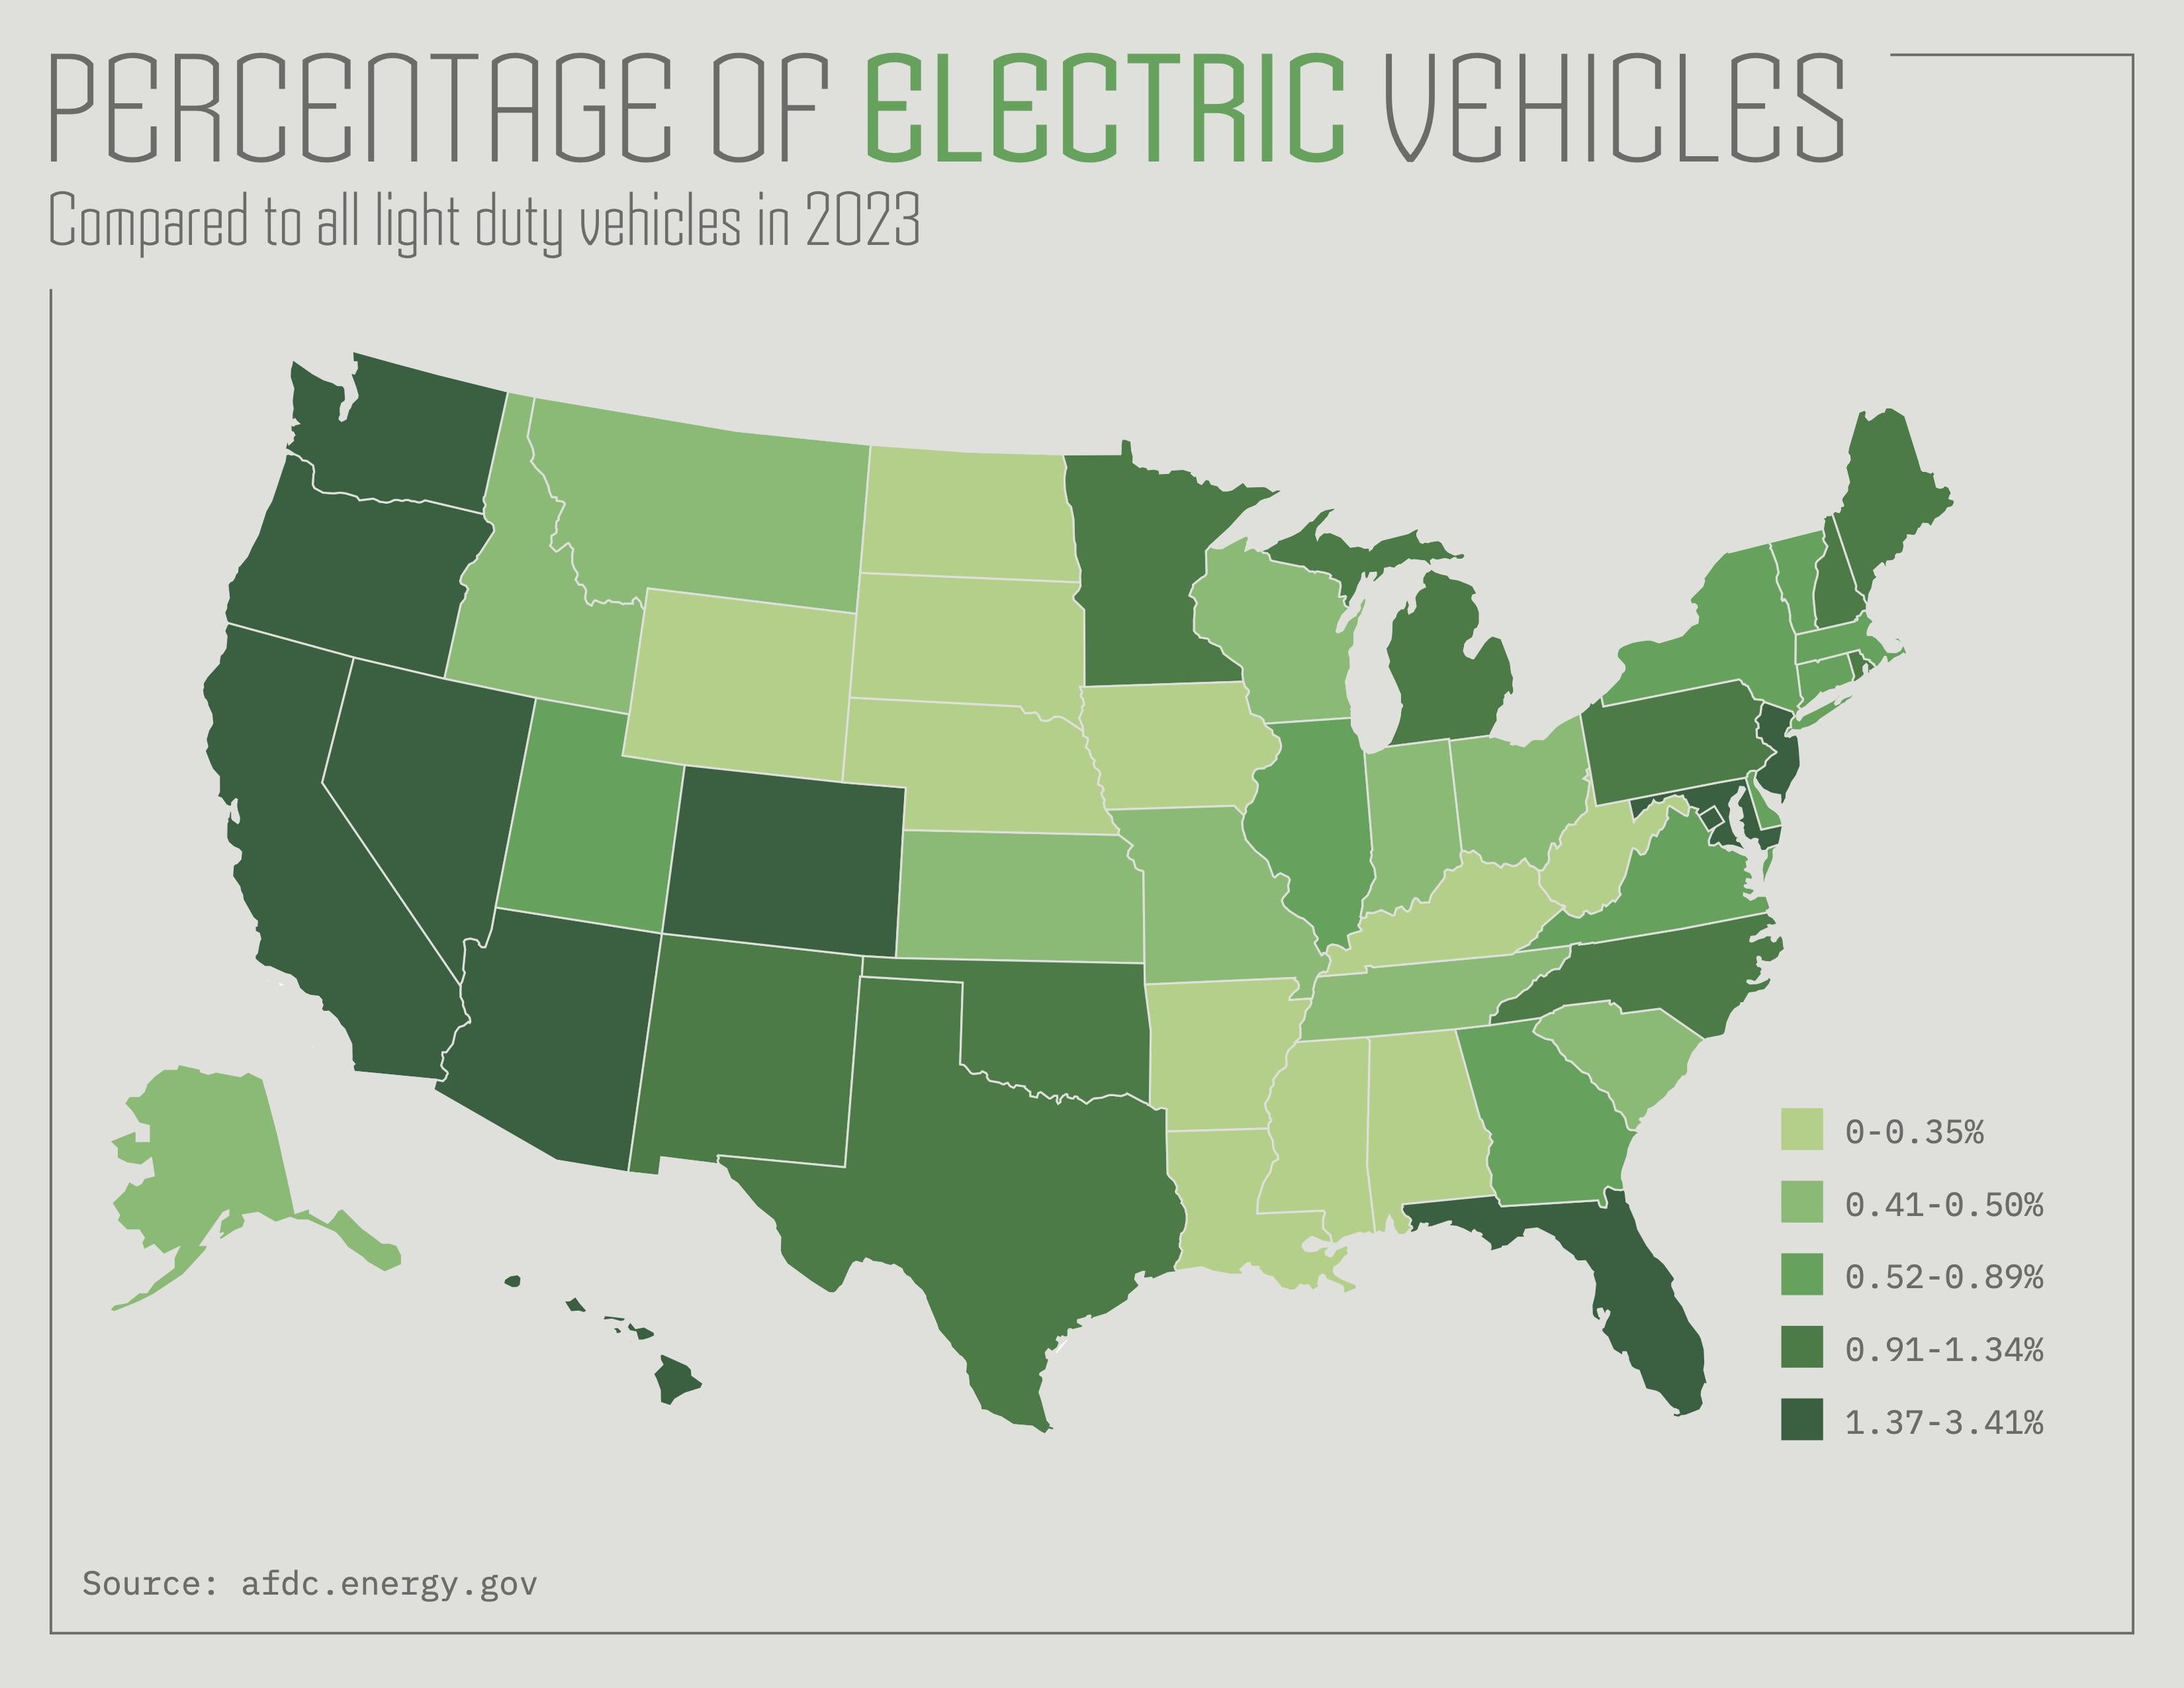
First time posting, hello! Read this post in r/dataisugly that was just a population map and saw a comment linking this map which didn't account for the fact some places simply have less cars. I wanted to show what percentage of vehicles are EVS by state, to account for the pollution that is actually being offset by driving electric instead of gasoline.
Posted by DonkeyBoth2548
12 Comments
At first glance I thought the percentage was way too low for my state, then I noticed the data is from 2023
Wow, largest percentage is 3.41%? China’s average has already surpassed 10%, and is almost 50% for new cars
The Vermont / New Hampshire percentages are surprising
Would it not be better to encourage the production and sale of diesel cars? If they used B100 biodiesel (100% biodiesel), this translates to a 93% reduction in carbon emissions.
And there is no 30-45 minute wait to “recharge” the vehicle.
And people that lived in apartments wouldn’t have to worry about overnight charging.
And we wouldn’t have to worry about uncontrolled fires that last several hours and require multiple fire engine companies to respond.
First color covers a range of 0.35%, second covers 0.09%, third covers 0.47%, fourth covers 0.43%, and fifth 2.04%?
IF you can charge at home or work and you don’t need to road trip with your EV, it’s a really great option.
Where are all the electrics in Florida? Visiting Orlando now and only see a few teslas. Nothing like my home state.
For CA it varies widely by county. I’ve noticed much higher rates in Santa Clara county so looked for a state breakdown.
EV adoption (which in the case of the link below is sales not total ownership) in Santa Clara and Marin were near 20% in 2022, whereas inland and farming areas are much lower.
Here’s a link. [see map about 1/2 way down](https://towardsdatascience.com/analyzing-californias-electric-vehicle-adoption-rate-using-dmv-data-with-pandas-and-geopandas-a67c105967ac/)
Finally! I made it to the 1%!
The title is garbage; sorry. “The percentage of electric vehicles compared to all light duty vehicles” is almost nonsense. (There is no comparison—you’re just presenting a single percentage. And it’s unclear what is the numerator and denominator for the percentage calculation.) All one needs to say is “Electric vehicles as a percentage of all light-duty vehicles” or “Percent of light-duty vehicles that are electric” or “Percent electric among light-duty vehicles”.
Idk, I’m still not entirely convinced EVs can fully replace gas.
What I believe CAN replace traditional gas card are hybrids.
I’ve been considering getting a Prius as my next car.
So, wherever people have the money to afford them.