
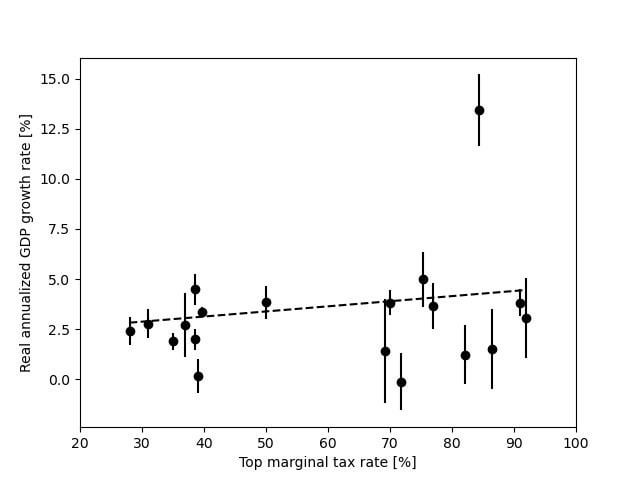
Either no correlation or slight correlation between high taxes on the rich and GDP growth. Quarterly annualized GDP growth from the St Louis Fed with standard error bars and an inverse error weighted least square linear regression fit.
Posted by Radical_Coyote
11 Comments
What about with median or average tax rates?
Could you please repeat this where one axis is a year behind, then a year ahead of, the other?
So 50-70 is probably the way to go — you know given we have massive deficits and debt.
What are these data points? Individual years? Or are you using blocks of time with variable length? And what are these error bars? My inclination is that this data set doesn’t make sense.
Where’s the p value for the slope >0? You don’t have too many data points, but it could still be useful.
So. R^2 is probably 0.2 with an alpha of 0.6?
You’re not going to have correlation between these two factors because the broader economy and other factors drive GDP growth. However, I think this is one of many things that disproved the idea that taxing the wealthy hurts the economy.
The slope only goes up because of that one outlier. The only conclusion you can make from this is that the one specific value is a magic solution to everything:)
The point of this post is to say that there is no correlation. I put the trend line there just for fun. I’m not trying to claim there is any significant correlation, I am claiming the opposite. Everybody please calm down
This is the top marginal normal income tax rate and not the capital gains and dividends marginal tax rate?
might help to generalize this to a group of comparable economies like the G7 or G20, potentially excluding economies where the numbers are questionable.