
![[OC] What’s in Processed Foods? edited](https://www.byteseu.com/wp-content/uploads/2025/07/sxogyzhll8cf1-1024x906.png "[OC] What’s in Processed Foods? edited")
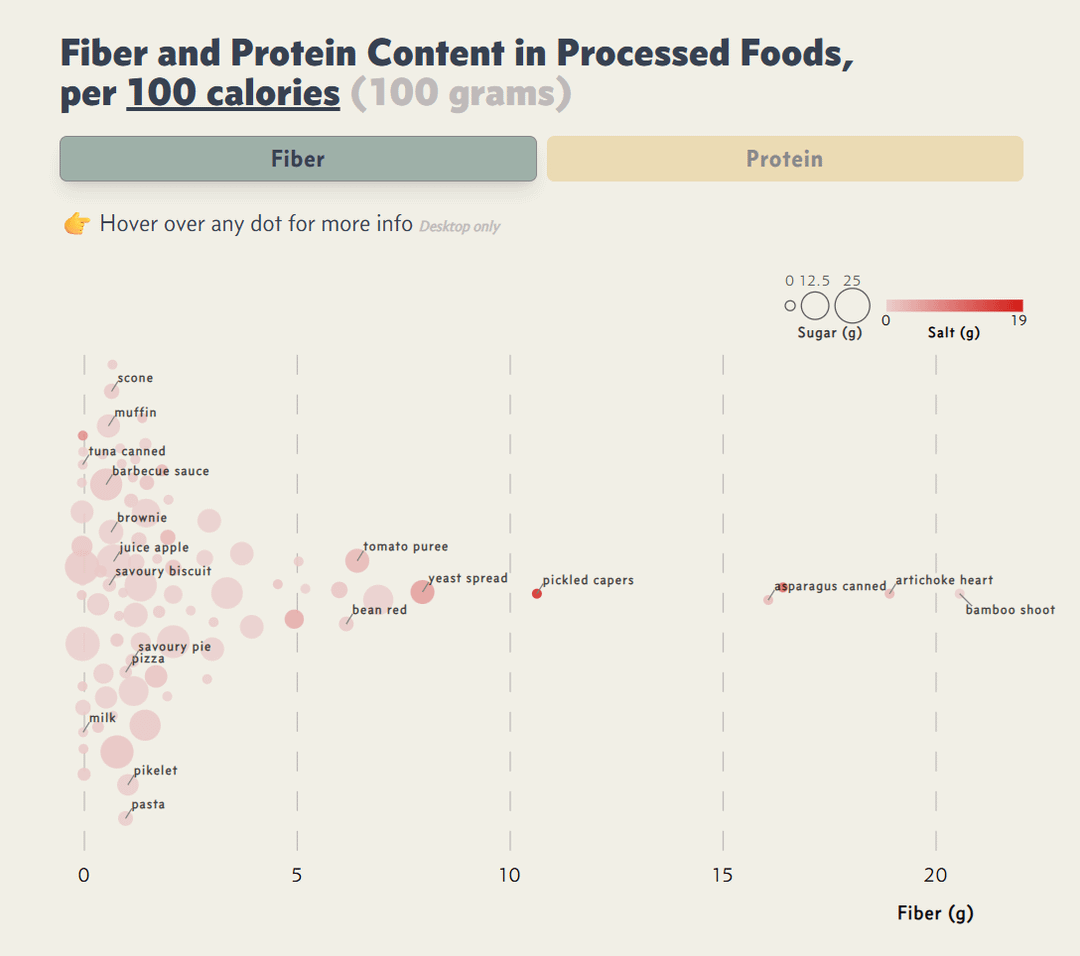
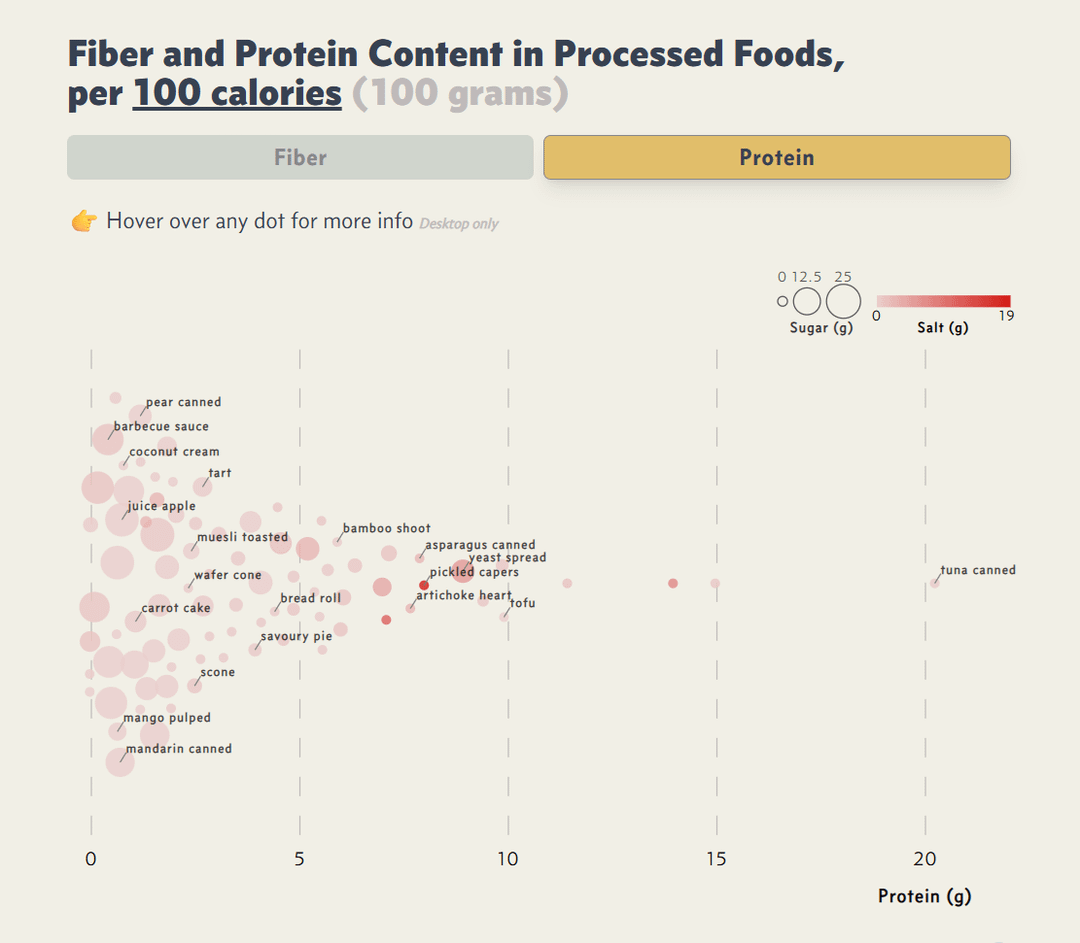
By now, we have plenty of evidence that eating a lot of ultra-processed food is associated with increased risks of various diseases. However, some people are unable to cook using raw ingredients. Luckily, many processed foods can still fit into a healthy diet. For example, some of them are high in fiber or protein, while containing little sugar or salt.
Based on your feedback, I edited my earlier chart, and now it shows fiber, protein, sugar, and salt per 100 calories.
Interesting things I noticed:
Bamboo shoot is the king (queen?) of fiber.
Tuna is the king of protein among animal-based sources, while tofu takes this place among plant-based options.
Canned asparagus and artichoke hearts are high in both fiber and protein.
Pickled capers are also high in fiber and protein but contain a substantial amount of salt.
Sauces like barbecue sauce have tons of sugar.
Another thing I learned while checking data: the composition of Marmite spread differs between the original (UK) and Australian (shown on the graph) versions. UK Marmite is sugar-free but has little fiber, while the Australian version contains added sugar but also more fiber.
Interactive chart is accessible here: https://www.lumipie.com/data-vis/fiber-processed-food/
You can also find table with a search function via this link.
Data source: Australian Food Composition Database
Tools: R (dplyr), D3, React, Tailwind
Posted by menadione
9 Comments
**Metric Conversion:**
• 100 calories = 418.40 J
*I’m a bot that converts units to metric. Feel free to ask for more conversions!*
brb, off to eat my bamboo shoots mixed with canned tuna
This is fun! As someone who about once a year thinks “I’m SURE there’s a way to eat healthy, get enough protein, not have too much salt/sugar, and not take a ton of time prepping/cooking after a long day of work, I just need to figure it out…”, this is really interesting! My other requirement is cost, but that’s more for the whole meal.
This is super nice thank you!! I wonder if you could add a third plot of fiber vs protein to see them together?
Asparagus and artichoke are high in protein relative to 100 calories, the basis used here, but realistically nobody would eat enough for a benefit. Artichoke hearts show as 0 grams of protein per serving but are also low calories of course.
Interesting plot, but I’m not sure what is meant by processed.
Anything prepped and cooked is processed even if only made from fresh ingredients. Like technically cutting something up and putting it in a can is processed, but what’s the difference nutritionally between it by itself?
I’d expect this to compare ready meals or repurposed stuff, like sausages
Wait, so a processed food is just anything that isn’t raw ingredients?
Nice! I’m curious, what are the three foods with 10-15g protein per 100 cal?
Just a tip, You could’ve set the Y axis as sugar or salt amount to lessen the amount of keys needed
RN we have foods distributed along the Y axis without clear meaning, which can be confusing
It would also be easier to analyze the data