

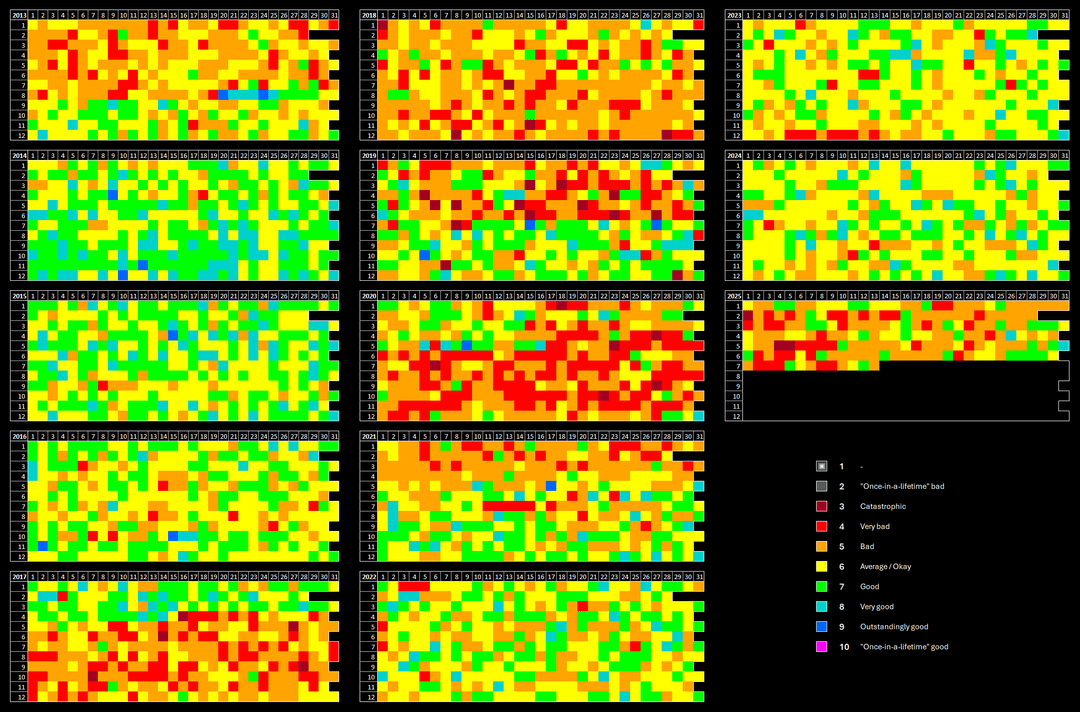
Image 1: Every day rated, on a scale from 1 to 10
I started doing this when I was 14. I'm now 25. Despite this being a 1 to 10 scale, I haven't given any 1's, 2's or 10's. It started as a list in an old notebook. After 2 years, I digitalized everything into an excel sheet and continued from there.
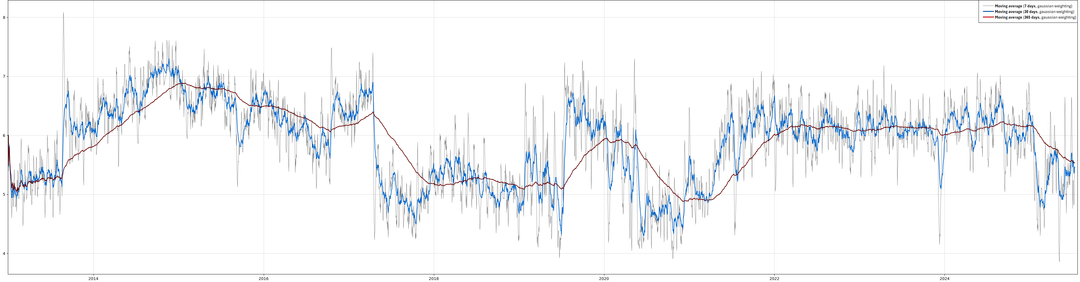
Image 2: Moving averages
The data visualized in a graph, with left-tailed (causal) gaussian weighted smoothing applied, stdev = d/2, window width = d, d = [7, 30, 365].
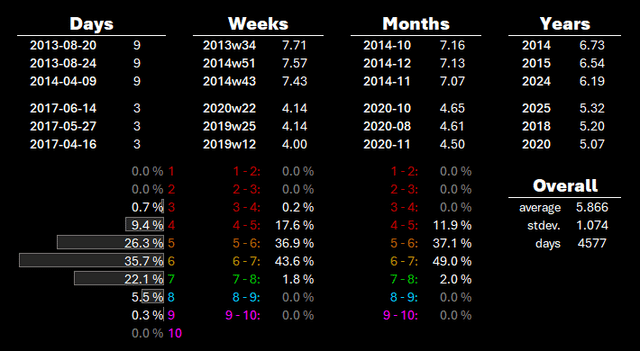
Image 3: Stats
The bottom and top 3 days, weeks, months and years, as well as some other stats.
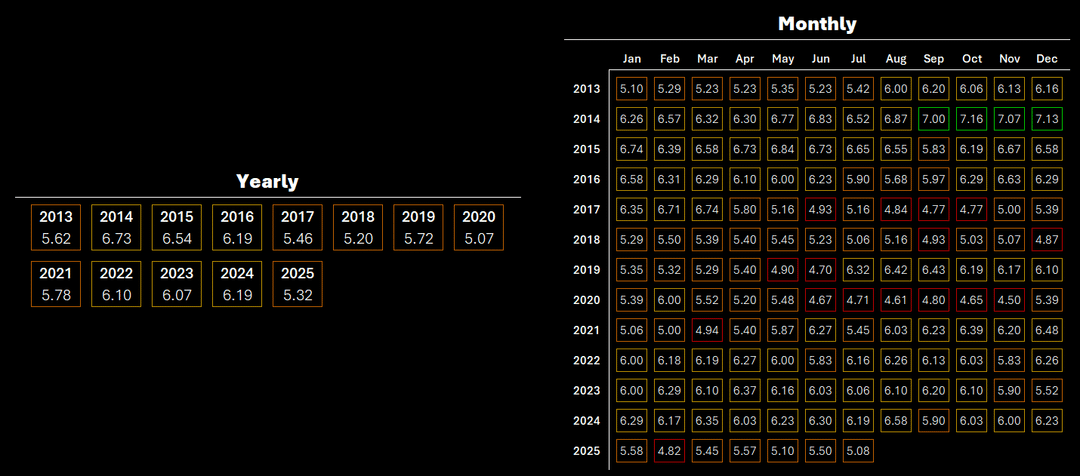
Image 4: Yearly and monthly overview
Average of each year and month.
Posted by Stille-Willem-D
32 Comments
This is very cool. Have you discovered any obvious patterns? Have you made any lifestyle changes as a result of analyzing this data?
Good inspiration for this kind of reflection. I see the pandemic was incredibly stressful. Any patterns you notice about 2017 and 2025? Both seem to be new rough times after relatively positive times.
Well done. I also agree 2020 was stressful af.
To quote a banger “Incredible but you are definitely autistic”
I can’t tell if this is a rough time or the average experience.
I’m probably one of the few people who don’t think the COVID period was horrible. I actually found quite some positives in it.
It must have sucked for extroverts though.
Oh wow! I have the same scale. Life its truly just a bunch of 5’s.
Been doing mine for 5 years tho
How do you track this? Just an excel or some other program?
This seems like a potentially super healthy reflection tool.
Was it REALLY a bad day or did your average day have a few bad moments?
There is a LOT of value in looking for positives, having a growth mindset, and challenging your initial feelings with tools like this.
Looks like you had some hard times 🙁
What happened on July 10th, 2019 such that it made the whole rest of the year better?
That’s a nice amount of data. Is this something you do right before bed? How do you handle days that start out catastrophic and end outstandingly good? Do they get a time-averaged score of Average/Okay?
I hope you have many good days coming up!
I love your discipline with the “once in a lifetime” rating.
It wouldn’t be once in a lifetime if it happened every 13 years!
Excellent work. I’ve been doing this since 2022 (we use similar colors it seems) but I don’t have data this in depth! I also rate months which contributes to the whole year’s score
Could you share a copy/blank of the excel sheet you use?
There’s a couple really fascinating inflection points. I wonder if OP would give an idea of what happened without prying too much to see what caused these huge life adjustments:
August 19/20, 2013. A bad year with a horrible day followed by a great day and that proceeded to make the next four years pretty good overall
April 16, 2017. Although 2016 was a slight slide in happiness, 2017 seemed to rebound and continue a long winning streak. But then things suddenly went to shit for two years on this date.
First half 2019: 12 catastrophes within four months is intense. This was wrapping up the bad two years. But then it all turned around suddenly, what got resolved?
2020 pandemic: looks like a bad year but seems almost entirely due to the pandemic right? No major events started or ended this down period otherwise it seems
Early 2025: another fairly abrupt downturn? How are you doing right now?
Christmas: at any rate it looks like you’ve learned to enjoy the holiday. It was almost always a bad or really bad day until recently
At what time of day do you report? And did you also make notes or just put a number? Like for example what happened that day etc
This is pretty amazing. If it helps, your 2025 and the average collective human experience is probably very close.
I hope for more purple for you
I think your definitions for 1-2 and 10 are aspirational and thus not necessarily useful. I suppose your wedding or child being born could be a 10 (and 1-2 the inverse of those), but I don’t see an issue with a great day at a theme park or a vacation with a loved one being a 10, or the loss of a pet a 1-2. That doesn’t devalue other wonderful or terrible things sharing those scores.
Also, what is 1 if 2 is “once in a lifetime bad?” What’re you saving it for? Once in many lives bad?
Interesting data all the same, keep going!
this does not look healthy. I maybe had 5 bad days in that time frame.
why so many bad or even catastrophic days?
I think you and I had a very different 2020. I loved that lockdown year, partly because I was insanely burnt out and moved to another state right at the start of the pandemic. The fact that I was able to land a job and work from home full time helped lift that massive amount of stress little by little.
Which software did u use? Is there an iphone app?
The way I could tell from a glance which grid was 2020…
When you are inputting how your day was do you ever go back and look at the whole thing to reflect? I would think over 13 years there is a lot of accessible reflection you could do.
Knowing that “oh this is what caused a long string of bad events” or vice versa and learning from that?
Also this could be intrusive to ask and feel free to ignore but during your string of bad days did you ever seek help like therapy or something? (Just curious not saying you need it.)
Fall 2014 seems to have been the happiest of your life
Report back in 13 with more blue and a purple
Where is that once in a lifetime good? Or does it not exist for this person yet? May you find it some day OP.
For the numbers aspect, I think scaling the minimum to the actual minimum and the same for the maximum will give a more accurate representation of the averages. Hope your 2025 gets better and closer to what November 2014 was!
Would be interesting if anyone on earth or country did the same so we could have an objective good day celebration
for someone with ADHD, that’s a quite impossible; I’m always impressed for the consistency of people’s tracking
Bravo! I’ve attempted something like this several times but ended up abandoning it before I got enough data.