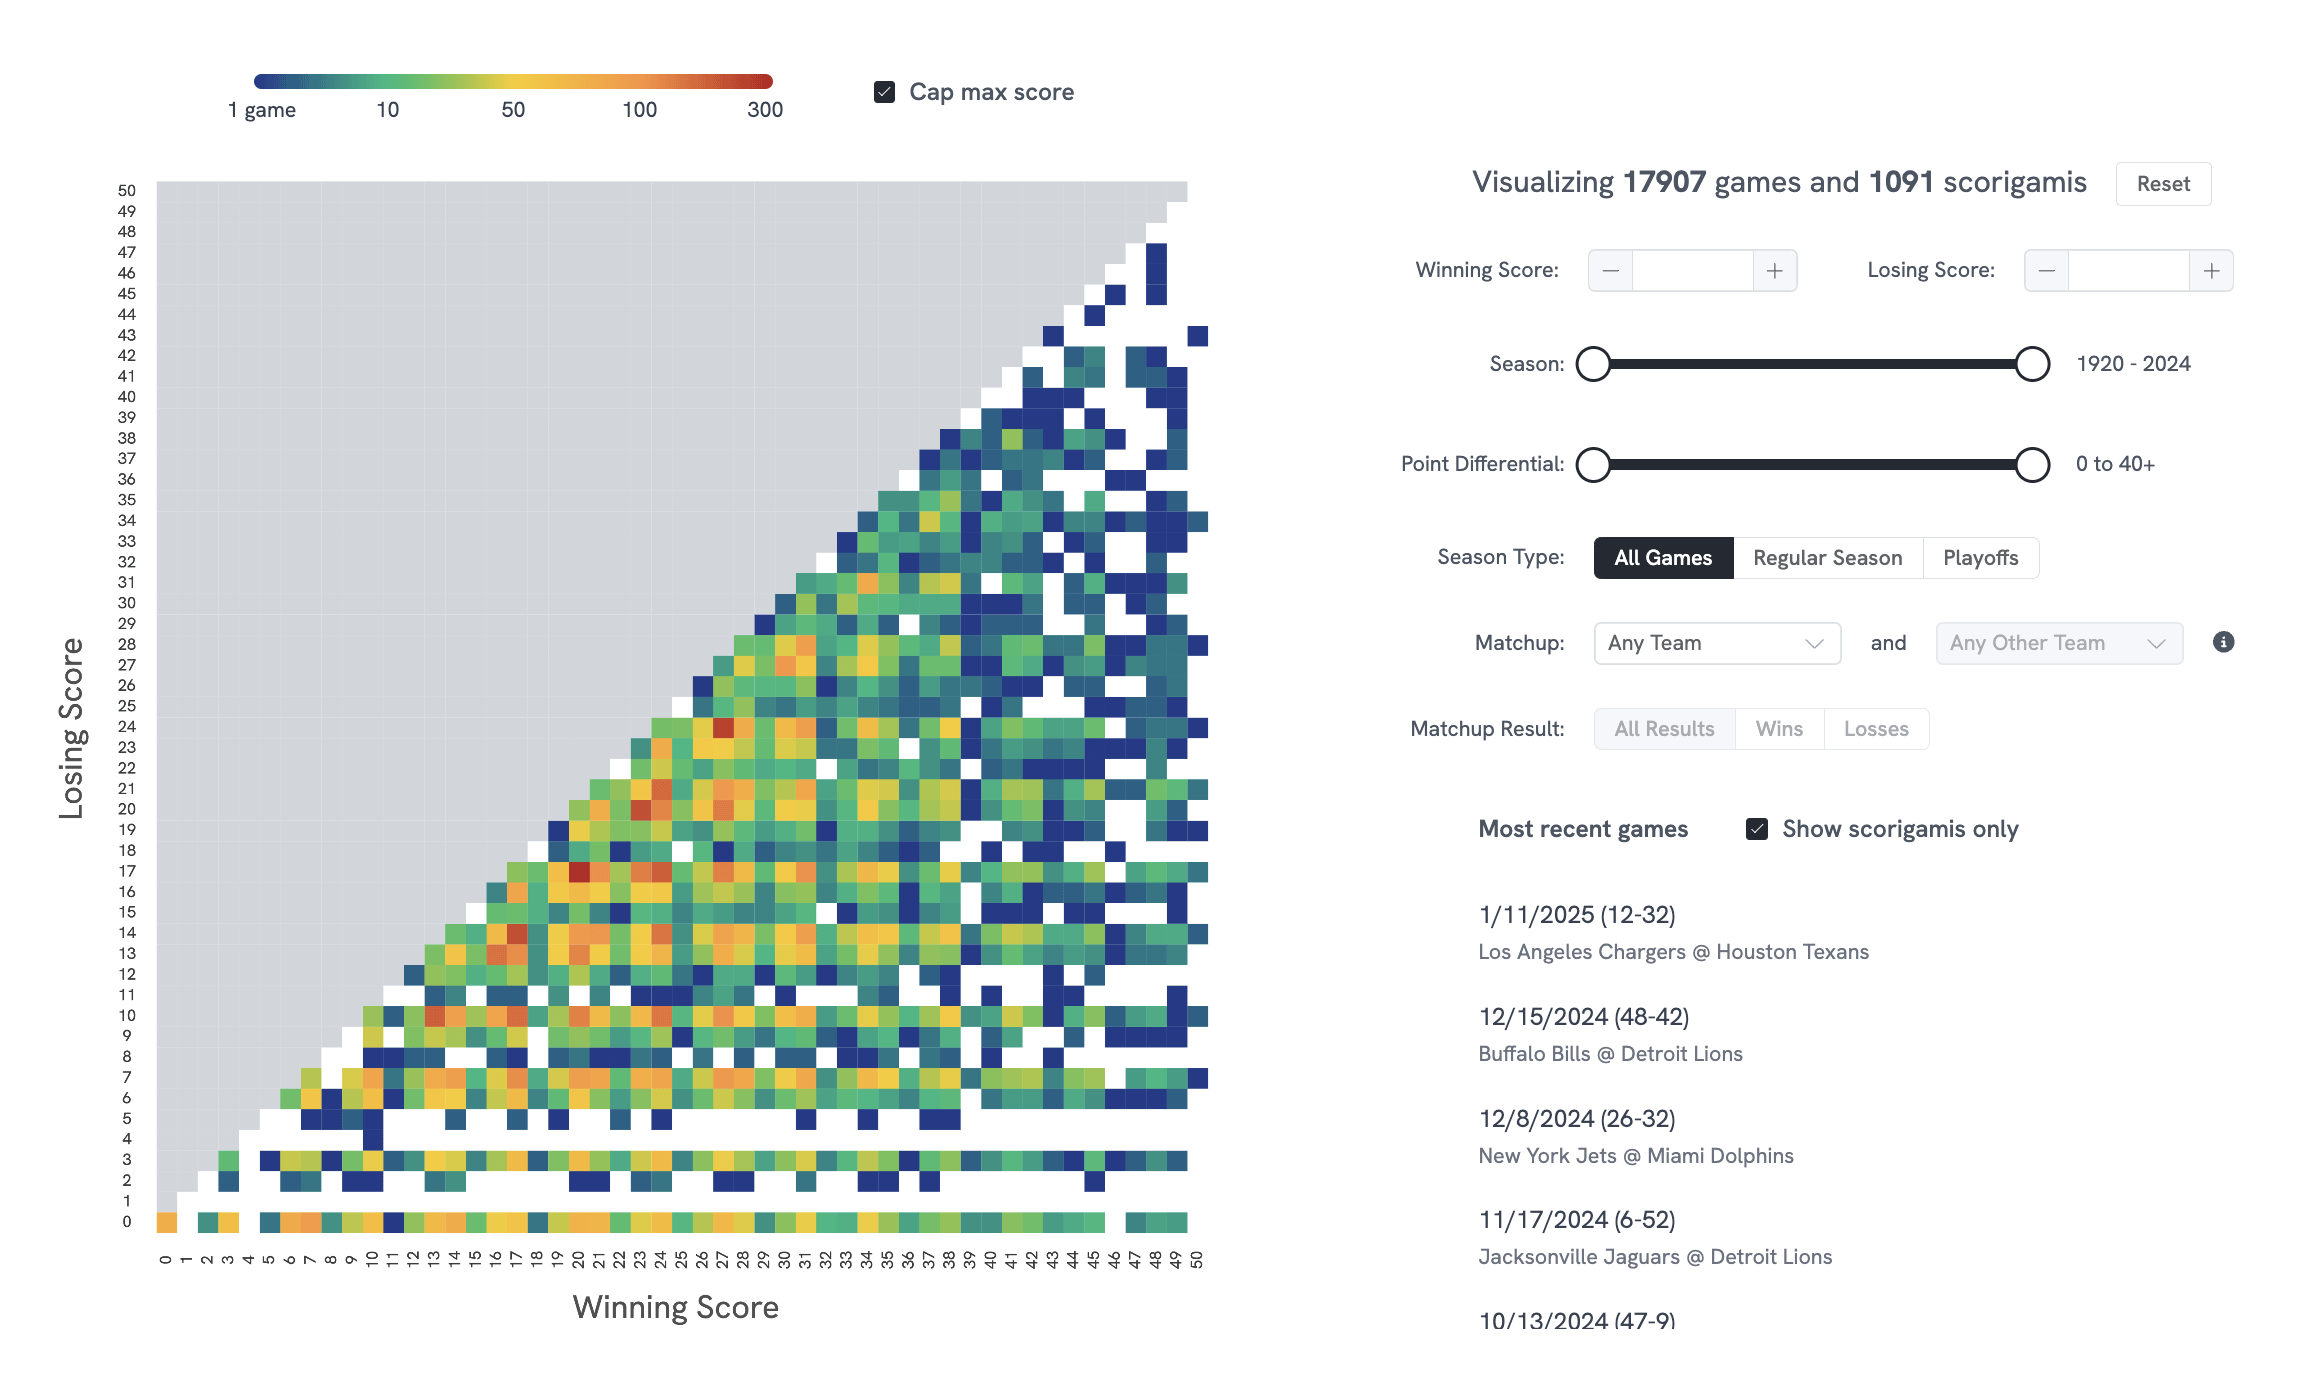
[OC] Every NFL score ever interactively visualized (link to interactive version in comments!)
Posted by Shriracha

![[OC] Every NFL score ever interactively visualized (link to interactive version in comments!)](https://www.byteseu.com/wp-content/uploads/2025/07/4ljtfhkiendf1-1536x918.png "[OC] Every NFL score ever interactively visualized (link to interactive version in comments!)")
[OC] Every NFL score ever interactively visualized (link to interactive version in comments!)
Posted by Shriracha
13 Comments
Live link: https://perthirtysix.com/nfl/scorigami
If you’re into the world of nerdy sports data, you may have heard of the idea of a “scorigami” before. A scorigami, coined by Jon Bois (who is an absolutely amazing storyteller) in this video, is the first time a specific score occurs in a league.
Since the term was coined, lots of folks have made cool visualizations around scorigami. I’ve always wished though that there was a visualization that let you easily slice the data up by season and matchup, so this tool is my take on that.
Hope you have fun checking it out!
Built using Vue and p5.js using data from Pro Football Reference.
The Fourier transform has some sharp features at 2pi/7
I am picking 20-17 for scores from now on
How is it possible in the age of the two-point conversion never to have had an 8-7 game?
Why would steal credit from the original John Bois masterpiece: https://nflscorigami.com/
Is this one of those games where you usually get 2-3 points at a time like basketball?
Yo cool site! Love scorigami.
Would it be possible for you to implement filtering scores in the chart by number of occurrences? I’d love to be able to see just scores have occurred 2 or more times, or 10 to 20 times, or something like that.
[deleted]
Amazingly the 4 row is not blank. So somebody got two safeties as their only score? Now you know.
May I introduce you to https://nflscorigami.com/
has there never been a score over 50 points?
I remember the one game that ended 43-8 😏
This is not every NFL score