
![NVIDIA RTX GPU Performance vs Price (At Launch vs Current) [OC]](https://www.byteseu.com/wp-content/uploads/2025/07/2g0460hgeudf1-1024x709.png "NVIDIA RTX GPU Performance vs Price (At Launch vs Current) [OC]")
This is an update to my original (now deleted) posts, with additional suggestions included.
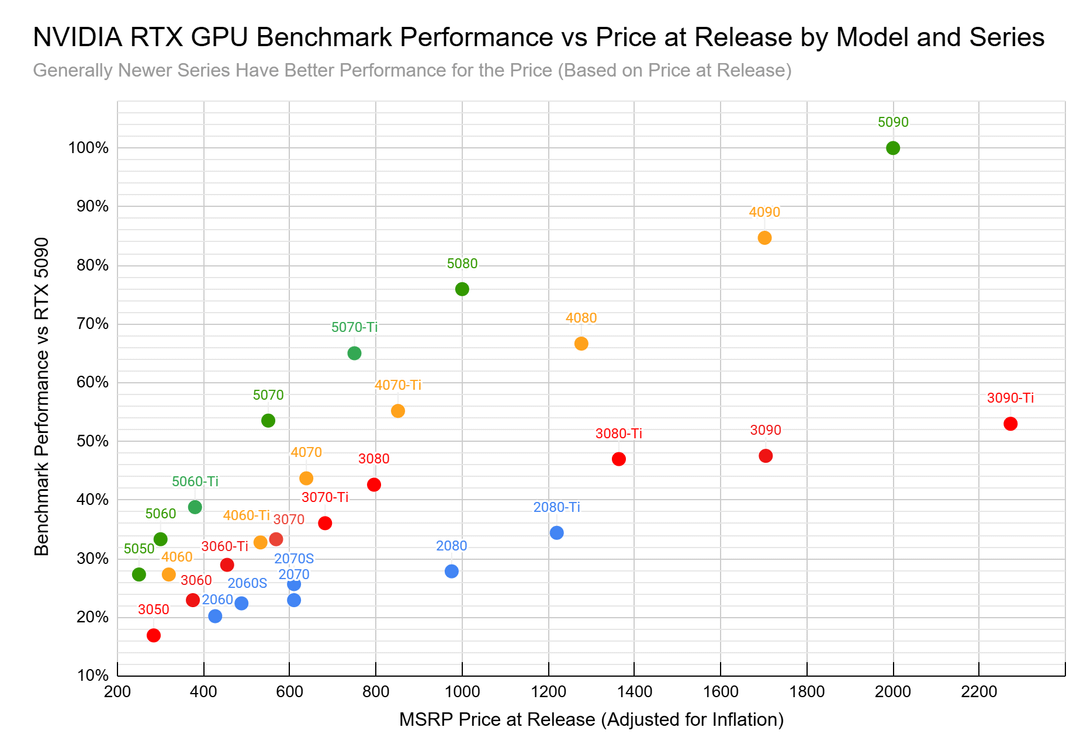
Image 1:
– It’s very clear that GPU architecture has improved over time, with the newest series offering, on average, better performance for the MSRP (adjusted for inflation).
- There are diminishing returns in terms of performance, especially at the high end. I believe this is because people who want the absolute best are often willing to pay any price.
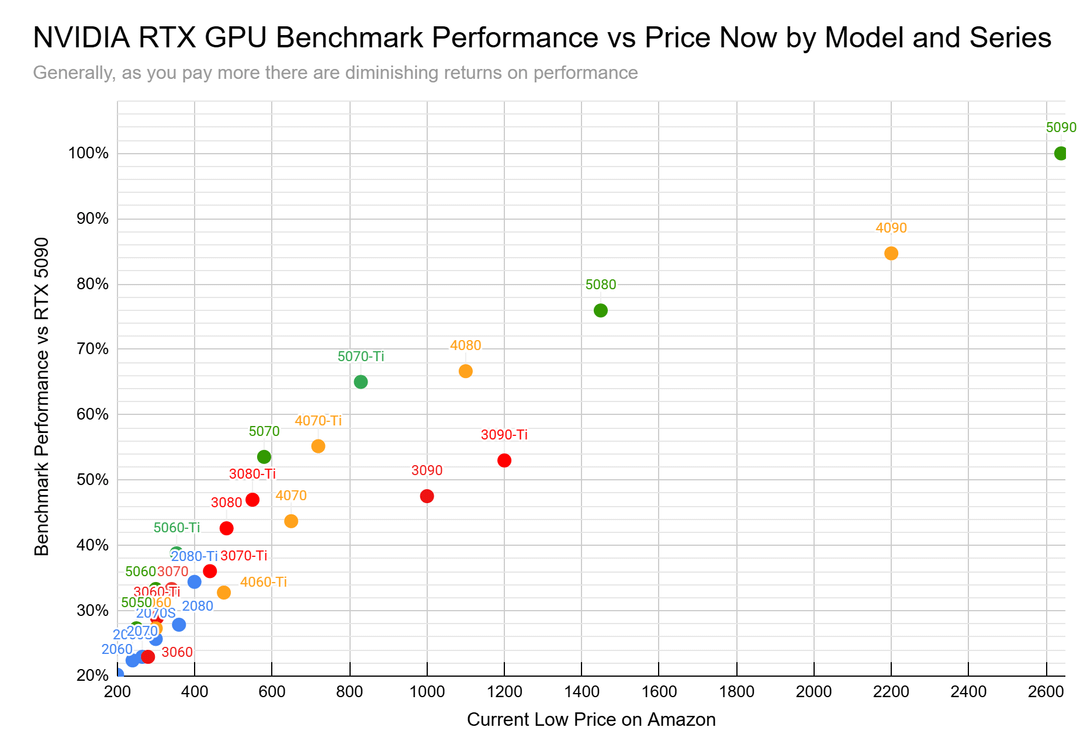
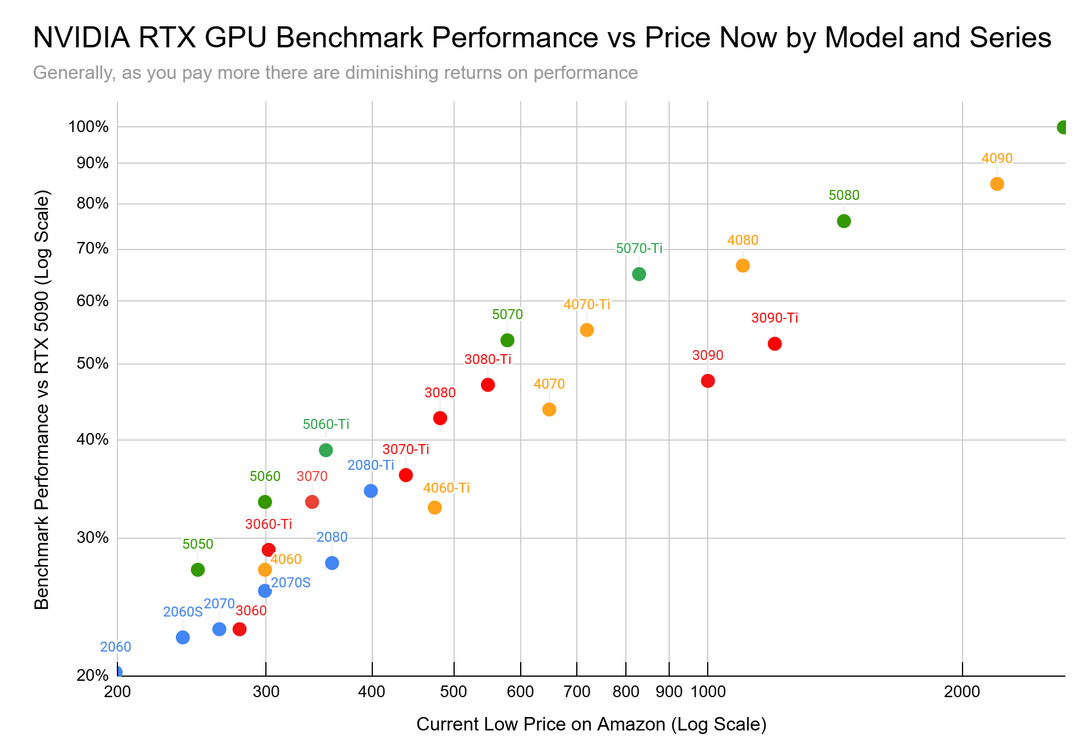
Images 2 & 3:
– It seems that actual prices adjust over time based on GPU performance to keep older series competitive.
- Image 2 is a little hard to read, so I included a log-scale version in Image 3.
Notes:
– All GPUs are compared against the RTX 5090. So, if a GPU shows 50% performance, it means it benchmarks, on average, at half the performance level of the 5090.
-
All benchmark data is from UserBenchmark, cross-checked with other sources where appropriate. I understand concerns exist regarding UserBenchmark’s accuracy, but these are mostly relevant when comparing different manufacturers or CPUs, which is not applicable here.
-
The "current low price on Amazon" reflects what I found in a quick search better deals may be available.
Posted by Large_Cantaloupe8905
12 Comments
5070Ti seems to be the play
Can you make a performance vs Watts?
My 1050 still going strong, thankfully.
Add AMD so the comparison is a bit better.
Performance vs Watts as well
These axes makes a lot more sense than your previous graphs.
That said, and I know a lot of people have you grief about this, but it was easier to follow each generation when they were connected by line.
This is a cool graph. Thanks for making it!
Is that performance number with or is it without *multi* frame generation for the 5090? If it is without, then it is more impressive cost:performance than I thought… If it is with, then I personally think the graph needs to make it clear.
Nobody is selling 5090 for 2k btw
It would be very interesting if you could add a chart that compares each card to its series‘ flagship. So 50 series gets compared to 5090 in relative performance, 40 series to 4090, 30 to 3090Ti and so on.
My 4070ti felt like a raw deal when I bought it (it was) but seeing this gen I’m not that mad about it.
Can you please share the raw data? I would really want to play a round with the data! Please!
Also I think the x axis should be inversed to see the best value ones in one quadrant easily
What about the super cards?