What factors do you think drive these costs up the most? Accidents, weather, theft, legal system… or something else?
Data Source: The data in this visualization was collected from major insurance providers including Geico, State Farm, Progressive, and Erie Insurance.
Visualization Tool: Created using Canva.
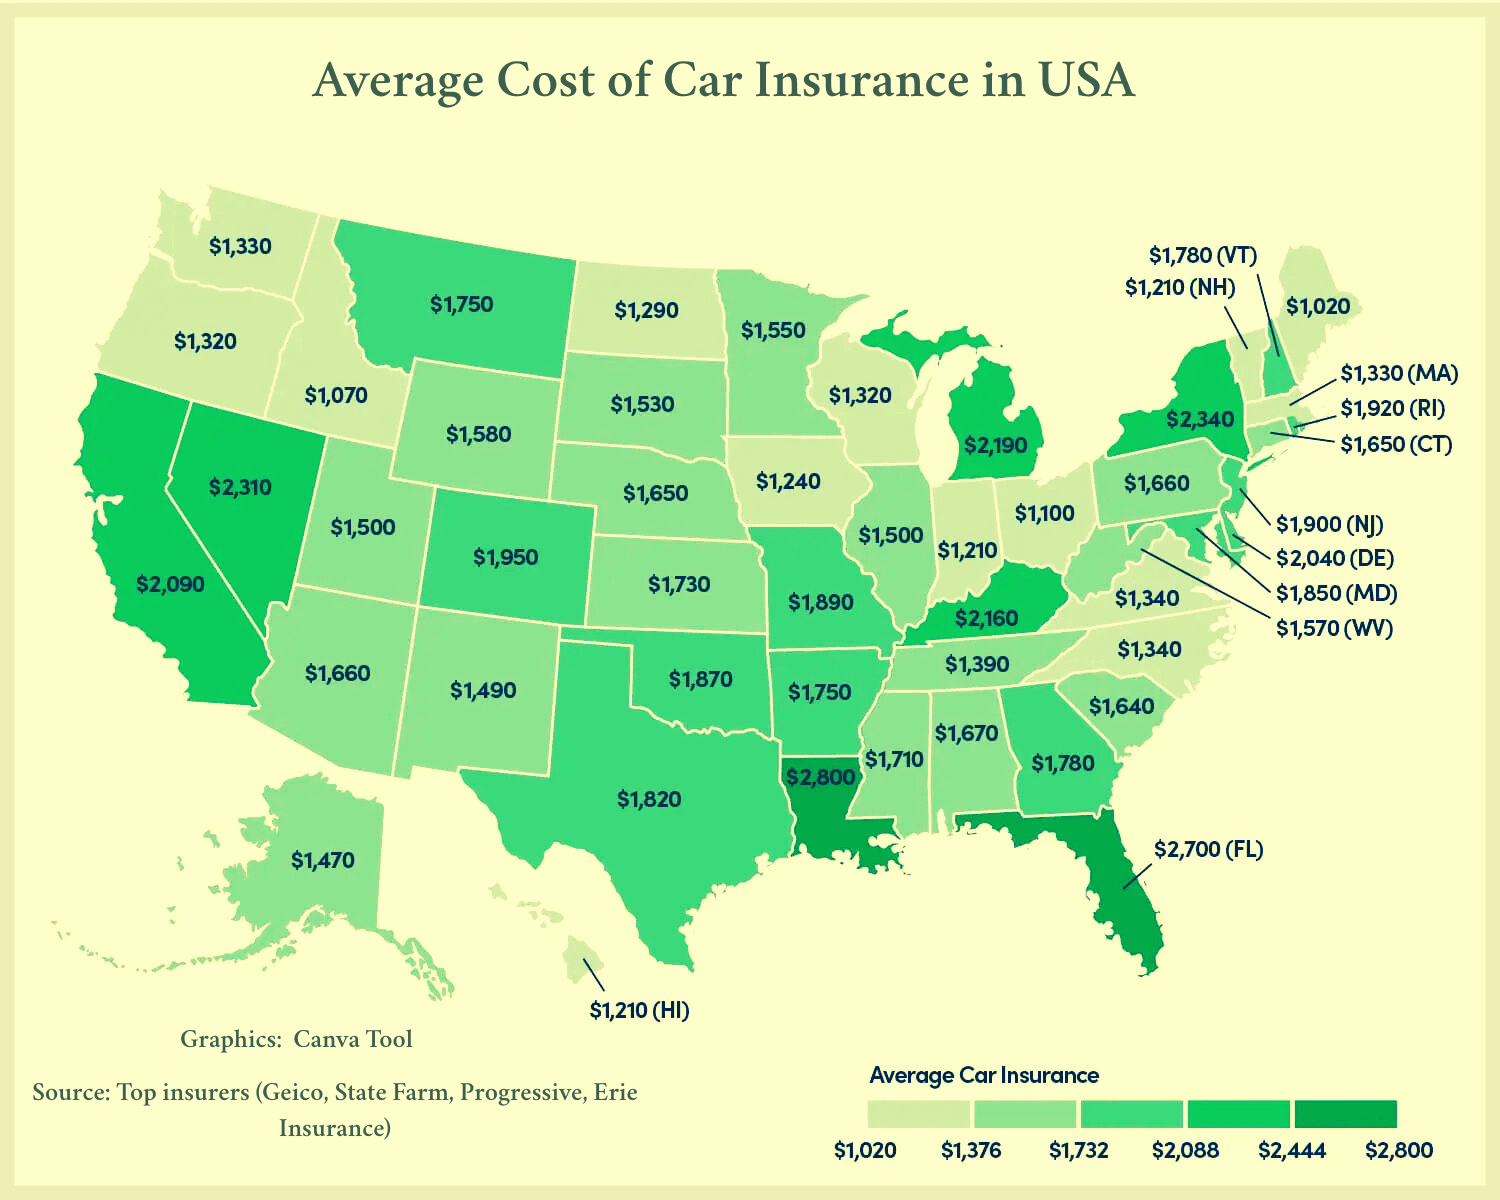
What it shows:
This map presents the average annual cost of car insurance in each U.S. state for the year 2025. The values represent estimates based on a mix of driver profiles and coverage levels.
maryjanesmister on
You’ve got VT and NH swapped…
andrewtater on
Not once in my life have I heard of Eric Insurance.
USAA, E-surance, fuck I watch Shaq pimp for The General.
Ok_Bake_4761 on
Wow, that seems expensive for me … I am not even paying $600 per year for my car for 2 drivers in Germany, but it’s also an old car so maybe thats why (a Hyundai I30cw from 2011).
90403scompany on
I question your sources (“top insurers?”). Are you actually going though market share reports to properly weigh averages? And are these top insurers publishing average premium by state?
As for ‘top insurers’ – if you’re just going to GEICO, State Farm, Progressive and Erie; you’re way off. Although my home state (CA; arguably the largest for premium) doesn’t publish market share by line of business, it’s clear that AAA, CSAA, Farmers, Allstate, Mercury are large players for **personal** private auto insurance; all of whom write more auto premium in the state than Progressive. Erie doesn’t even write in the state (in fact, they only write in 12 states; so why are you using them at all?)
Finally – I guess in the macro, ‘average premium’ tells a story but rates and formulae are so minute; **especially** when you don’t break out premium by liability and physical damage coverage (the former which would be impacted by accidents/legal; the latter by weather/theft)

![[OC] Average Cost of Car Insurance by State in the USA (2025)](https://www.byteseu.com/wp-content/uploads/2025/07/w75dcy3uclef1-1024x819.png "[OC] Average Cost of Car Insurance by State in the USA (2025)")
5 Comments
What factors do you think drive these costs up the most? Accidents, weather, theft, legal system… or something else?
Data Source: The data in this visualization was collected from major insurance providers including Geico, State Farm, Progressive, and Erie Insurance.
Visualization Tool: Created using Canva.
What it shows:
This map presents the average annual cost of car insurance in each U.S. state for the year 2025. The values represent estimates based on a mix of driver profiles and coverage levels.
You’ve got VT and NH swapped…
Not once in my life have I heard of Eric Insurance.
USAA, E-surance, fuck I watch Shaq pimp for The General.
Wow, that seems expensive for me … I am not even paying $600 per year for my car for 2 drivers in Germany, but it’s also an old car so maybe thats why (a Hyundai I30cw from 2011).
I question your sources (“top insurers?”). Are you actually going though market share reports to properly weigh averages? And are these top insurers publishing average premium by state?
As for ‘top insurers’ – if you’re just going to GEICO, State Farm, Progressive and Erie; you’re way off. Although my home state (CA; arguably the largest for premium) doesn’t publish market share by line of business, it’s clear that AAA, CSAA, Farmers, Allstate, Mercury are large players for **personal** private auto insurance; all of whom write more auto premium in the state than Progressive. Erie doesn’t even write in the state (in fact, they only write in 12 states; so why are you using them at all?)
Source: 2024 California Dept of Insurance Market Share Report [[link](https://www.insurance.ca.gov/01-consumers/120-company/04-mrktshare/2024/upload/Top25grps2024.pdf)]
Finally – I guess in the macro, ‘average premium’ tells a story but rates and formulae are so minute; **especially** when you don’t break out premium by liability and physical damage coverage (the former which would be impacted by accidents/legal; the latter by weather/theft)