
Data from the met office
Code python and matplotlib is here so you can remix it if you want to
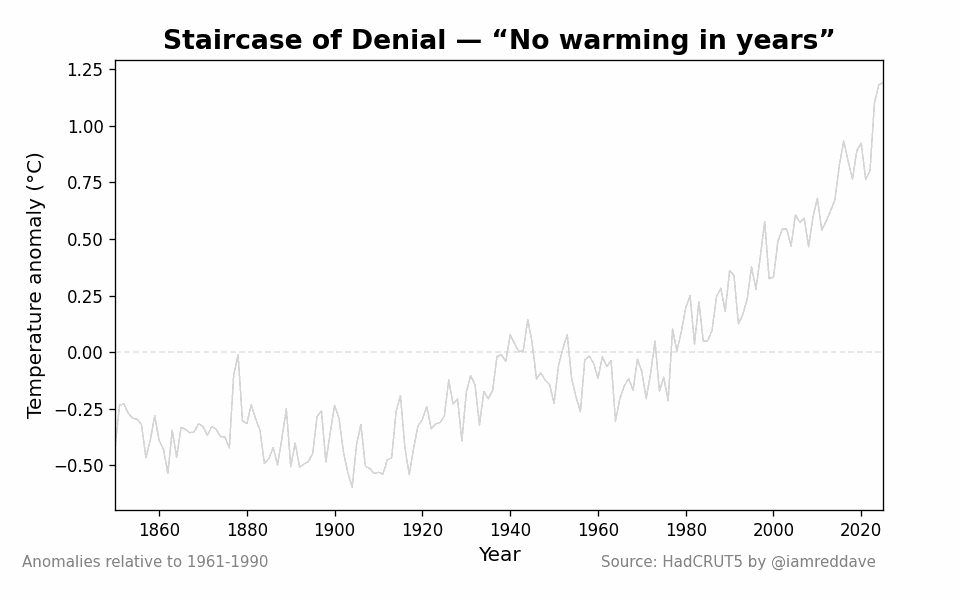
the idea is that between every record hot year people go 'look it hasn't gotten warmer in X years global warming is disproven. Checkmate now, king me'
And i want to make a way to easily see howthat warming continues inside normal variations (things like the el niño cycle) and a new record year is coming.
I heard about the escalator of denial here and wanted to update it and make the code public https://skepticalscience.com/graphics.php?g=465
Posted by cavedave
21 Comments
Human brain has difficulties understanding data noise in a decade scale, it’s sad how that is used by bad faith arguments…
number goes up means good, right? RIGHT?
Yep. Why else do you think Billionaires are desperately trying to establish authoritarian governments across the world?
It’s really shocking how much has accelerated in the last 60 years vs the first c200 years of industrialisation.
Makes perfect sense when you consider exponential population growth and the majority of countries being now industrialised. Even knowing that, it’s really eye opening to see it so plainly visualised.
No time in earths history has the average temperature risen this fast in this extremely little time but I’m sure it’s just natural
/s
“This is perfectly normal for an El Niño year.”
My brother in Christ I have been alive long enough to see and feel the difference compared to when I was a child. In my area it would snow by Halloween sometimes. Often I had to wear my coat over my costume. The last really cold year I remember like that was maybe 2007?
Last year it barely snowed all winter. And then, in the spring, when we are normally dealing with flash floods when the snow melts in the mountains we were getting 100 degree days in May.
This. Is. Not. Good. (Also, cool chart.)
“Rome has never been as brightly lit as tonight.” 64 C.E.
Why does it appear to go down after the start of WWII? Or is that incidental?
Fantastic visualisation and data perspective!
What’s the go with the time period 1940-1980? It rose and then averaged out during this time period. Is there a known reason??
so 1°C rise in 80 years? boo hoo im so scared
I love your effort, it shows someething that I was personally unaware off and should be popularized in some geography books for kids, seriously.
However, for anyone who doubts everything around them (even their brain /s) this data doesn’t mean much. Like you cant prove them that yours data is reliable and has any connection with real world
That’s a really cool and intuitive way to visualize this concept… Thanks!
This has to be one of the extremely rare cases in this sub where the animation does actually add value to the plot. Saving this. 🙂
From a US perspective.
I unfortunately believe this is a lost cause. There is too much profit to be made by ignoring this and the amount of change that would have to be brought about to make a significant difference is beyond the scope of the person of average intelligence to fathom. This includes me. Here in the US most are not willing to sacrifice much.
Go back to MWP. The data is out there. Also plot the model forecast against observed temps. Data is beautiful.
Damn, it’s all downhill from here, right?
Very few people deny a rise in average temperatures is occurring. What people dispute is that if banning straws or forcing westerners to eat bug burgers whilst the “developing world” industrializes and explodes in population will have any meaningful effect on anything
Genuine question. What’s the ‘nightmare scenario’? Like really. Since the assumption seems to be we aren’t really gonna stop this.
But with numbers of population, tons of food per capita, etc. In 2050? 2100? And how do those numbers compare to today?
I saw one demographic study that said (paraphrase) 2025 population 8B. 2100 _curb warming_ 10B. 2100 _worst case_ 7B.
Yes, individually, probably sux massively. But… Doesn’t sound like _the end of life as we know it!_
[ Removed by Reddit ]
nazi rising, Ukraine war, Gaza massacre, etc. all of these horrible events are nothing compared to climate change risks