
![[OC] I made an interactive dashboard to explore NYC rentals data](https://www.byteseu.com/wp-content/uploads/2025/07/jcor5be7iwff1-1024x724.png "[OC] I made an interactive dashboard to explore NYC rentals data")
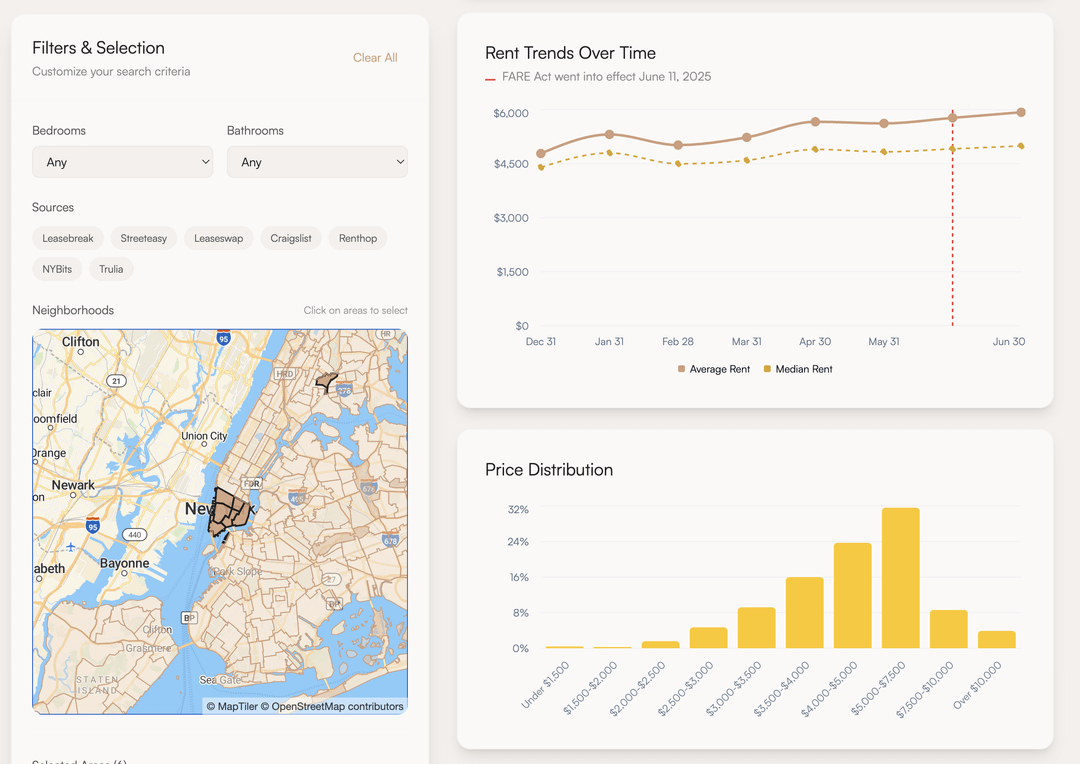
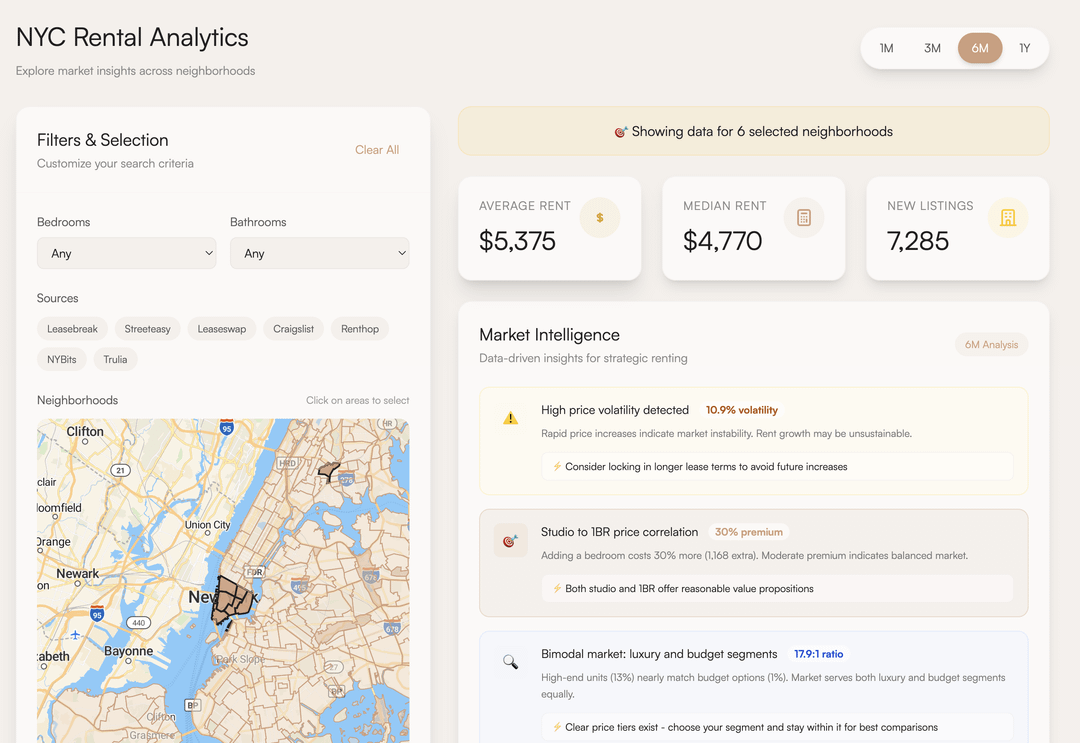
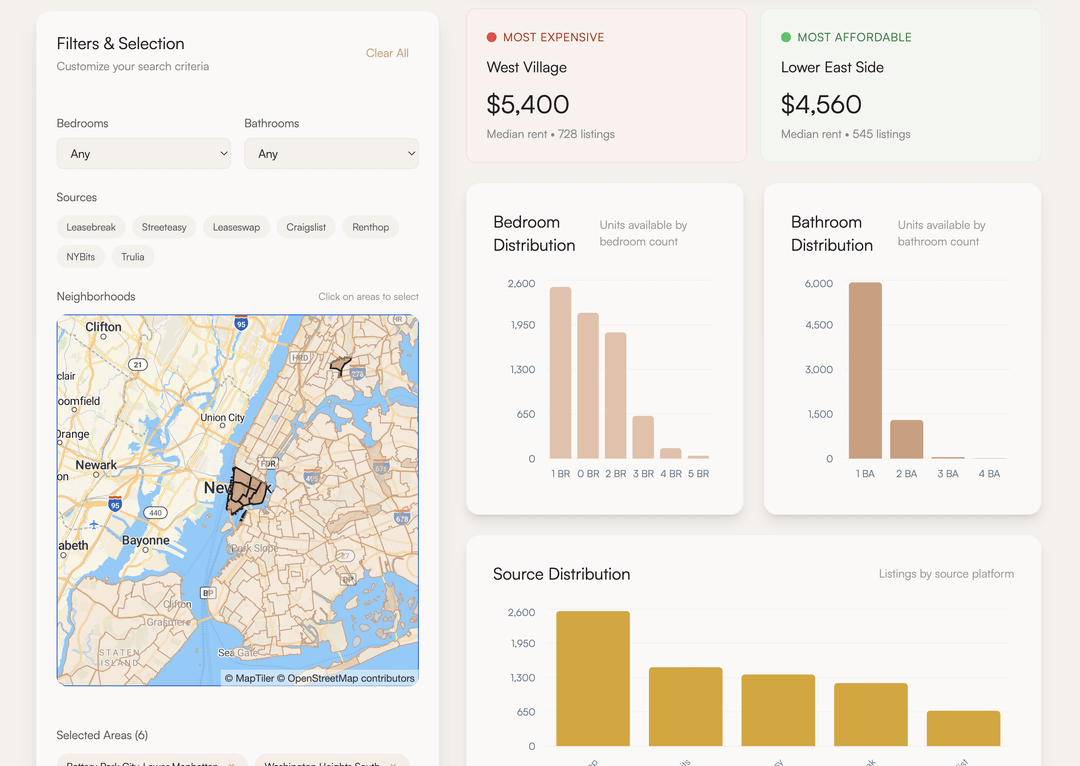
historically, rentals in NYC have been pretty wild. the median 1BR in West Village cost $5,750/month. about a month ago, NYC passed a law to ban broker fees which many predicted would have increased rents. I realized I had access to some original data from a previous project so I built a dashboard to help me visualize the changes and see for myself.
you can filter by neighborhoods, bedrooms, original source where the rentals were posted, and select a timeframe.
this is still a work in progress, so apologies in advance for any issues you encounter. I would love any feedback on how to improve it and/or what other visualizations i should add. known issues include:
– some neighborhoods like Prospect Park will also automatically select other, unrelated, neighborhoods when selected
– sometimes even when you filter by 1BR it will also include some 2BR
you can play around with the dashboard yourself on https://leaseswap.nyc/analytics
Posted by thisisgiulio
10 Comments
Damn y’all are paying $5k a month in rent? I’d rather be homeless and shower in a gym
I like your UI! What tool did you use to develop it?
Good UI. Is the data based solely on those listed on your platform?
Is it live data? How often is it update, and where is it sourced from?
do you have the github link? i’m curious how you did this, nice work
Wow! Can you adapt this tool for Boston rentals too? They just passed their own broker’s fee ban that goes in effect in a couple days and it would be interesting to compare.
That’s legit really cool. Saving this
Opendata! You’re welcome
Great work OP, beautiful / minimal UI & great story telling with the score cards & visuals.
Are you just grabbing the data from publicly available APIs on those services? Sub question, is this a hobby or related to your work? Great stuff.
Looks pretty good. I happened to check the UWS and noticed that the data seems to be the same when you click on Lincoln Square and then UWS so apparently drawing from the same data. Also, I suppose there’s a chance that there are duplicate listings among the different sources. These are just some very minor points – UI is great though! I enjoyed clicking through!