
![[oc] steel economy in Warera](https://www.byteseu.com/wp-content/uploads/2025/07/dt0u3ztxw0gf1-1024x573.png "[oc] steel economy in Warera")
This is a project we're working on with the game's community to analyze the economy of certain materials. It needs polishing and we have data limitations, but any feedback for improvements is welcome.
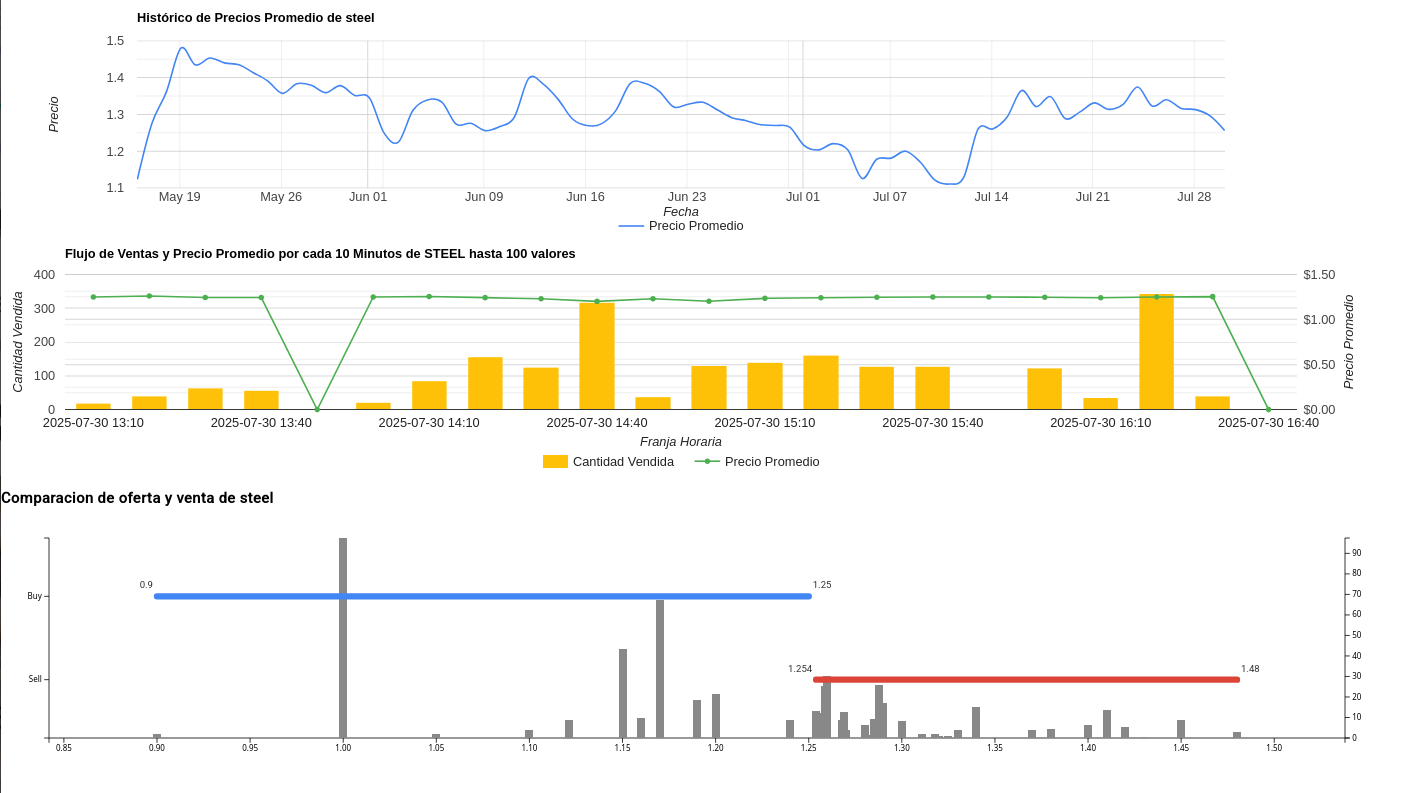
The data is obtained through the game's official API.
Posted by Cjav-latam
1 Comment
First graph shows the evolution of the steel price over time.
Second graph shows the price and transaction volume every ten minutes.
Third graph shows the market supply and demand with its real maximum price, real minimum price, and quantity. (Trying to clean up erroneous values.)
This was done in Angular 18, Google Chart, and D3. I’m considering migrating everything to D3.