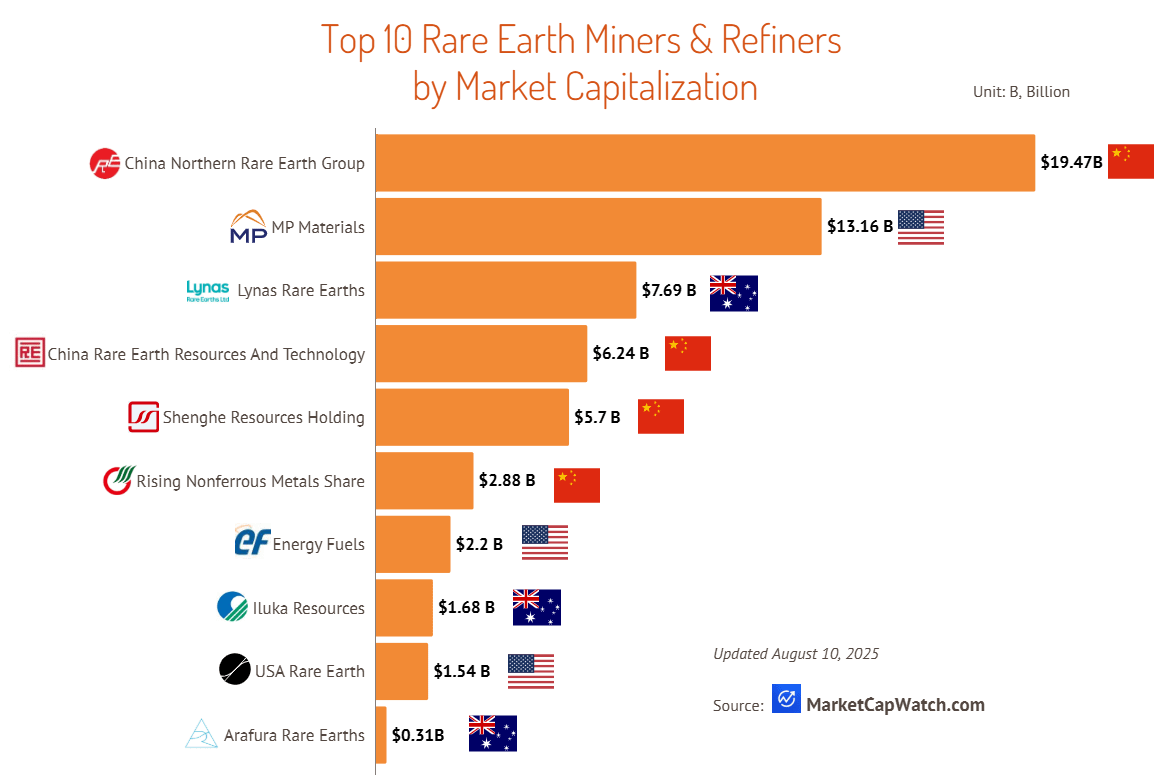
Hey everyone, OP here with the details on the data. This visualization comes from a larger analysis I conducted on the global rare earth mining and refining sector, focusing on the largest publicly listed companies by market capitalization as of August 2025.
**Data Source:** All market capitalization figures were obtained directly from [MarketCapWatch](https://www.marketcapwatch.com/), ensuring consistency across currencies and exchanges.
**Methodology:** Companies were included if their primary business is the mining and/or refining of rare earth elements, with downstream magnet/component makers and diversified miners with minimal rare earth exposure excluded. Market capitalizations were converted to USD where necessary and rounded to two decimal places. The ranking was compiled by sorting all eligible companies from highest to lowest market cap.
**Tools:**
* **Data Collection & Processing:** Raw market cap data was compiled and organized in **Microsoft Excel** for cleaning, conversion, and ranking.
* **Visualization:** The chart was created in **Infogram** and then refined for clarity and presentation.
ClearlyCylindrical on
All in all, it seems like there’s not a whole lot of money in it
moreesq on
Is there a way to tell what proportion of the Chinese companies’market capitalization is due to the Chinese government buying stock? If that is a significant proportion, it seems that the comparisons are not apples to apples.

![[OC]Top 10 Rare Earth Miners & Refiners by Market Capitalization](https://www.byteseu.com/wp-content/uploads/2025/08/mr9ubcv92dif1-1024x680.png "[OC]Top 10 Rare Earth Miners & Refiners by Market Capitalization")
3 Comments
**Source & Methodology**
Hey everyone, OP here with the details on the data. This visualization comes from a larger analysis I conducted on the global rare earth mining and refining sector, focusing on the largest publicly listed companies by market capitalization as of August 2025.
**Data Source:** All market capitalization figures were obtained directly from [MarketCapWatch](https://www.marketcapwatch.com/), ensuring consistency across currencies and exchanges.
**Methodology:** Companies were included if their primary business is the mining and/or refining of rare earth elements, with downstream magnet/component makers and diversified miners with minimal rare earth exposure excluded. Market capitalizations were converted to USD where necessary and rounded to two decimal places. The ranking was compiled by sorting all eligible companies from highest to lowest market cap.
**Tools:**
* **Data Collection & Processing:** Raw market cap data was compiled and organized in **Microsoft Excel** for cleaning, conversion, and ranking.
* **Visualization:** The chart was created in **Infogram** and then refined for clarity and presentation.
All in all, it seems like there’s not a whole lot of money in it
Is there a way to tell what proportion of the Chinese companies’market capitalization is due to the Chinese government buying stock? If that is a significant proportion, it seems that the comparisons are not apples to apples.