
![[OC] Global Economy by Country & Sector](https://www.byteseu.com/wp-content/uploads/2025/08/c8g617fuhhif1-1024x1021.png "[OC] Global Economy by Country & Sector")
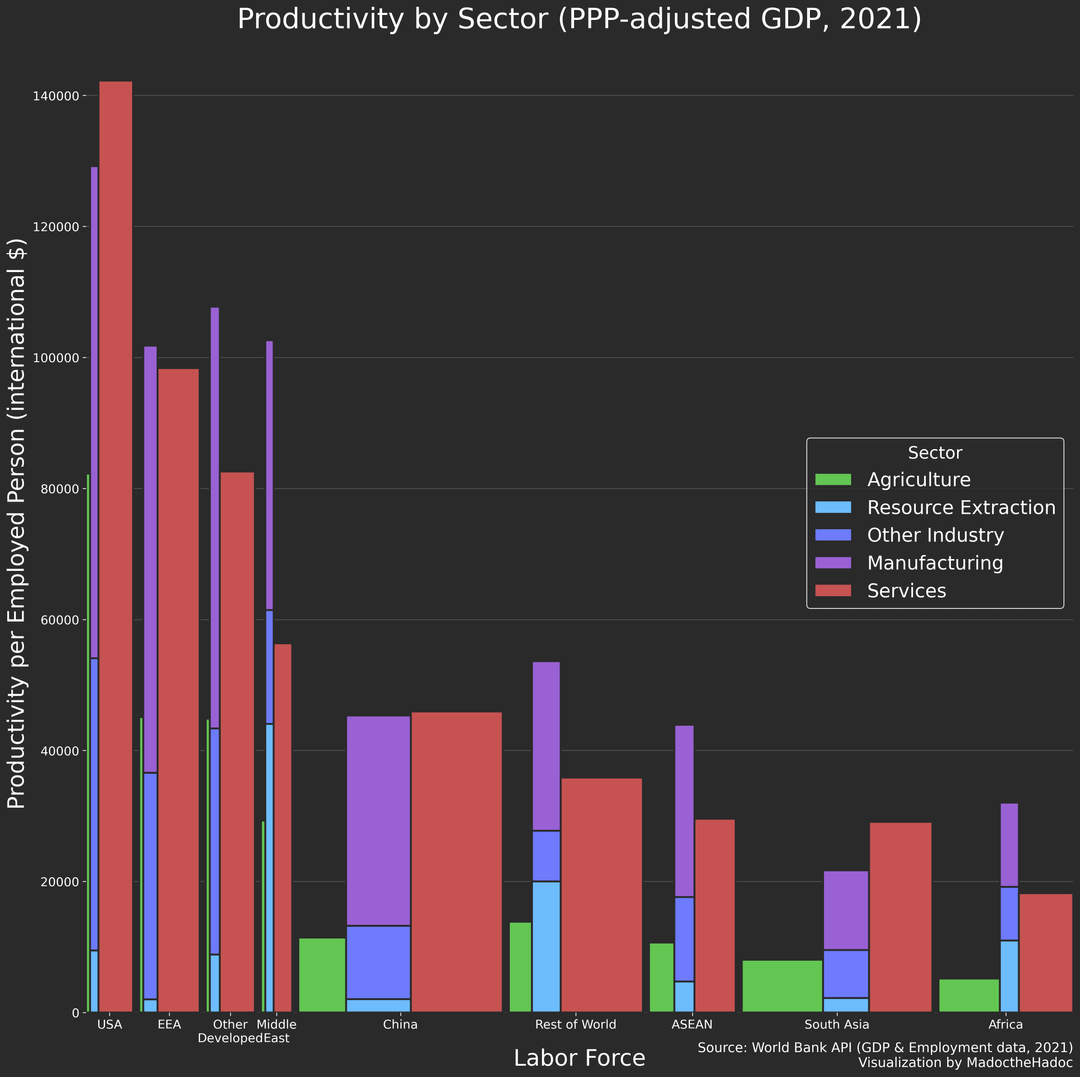
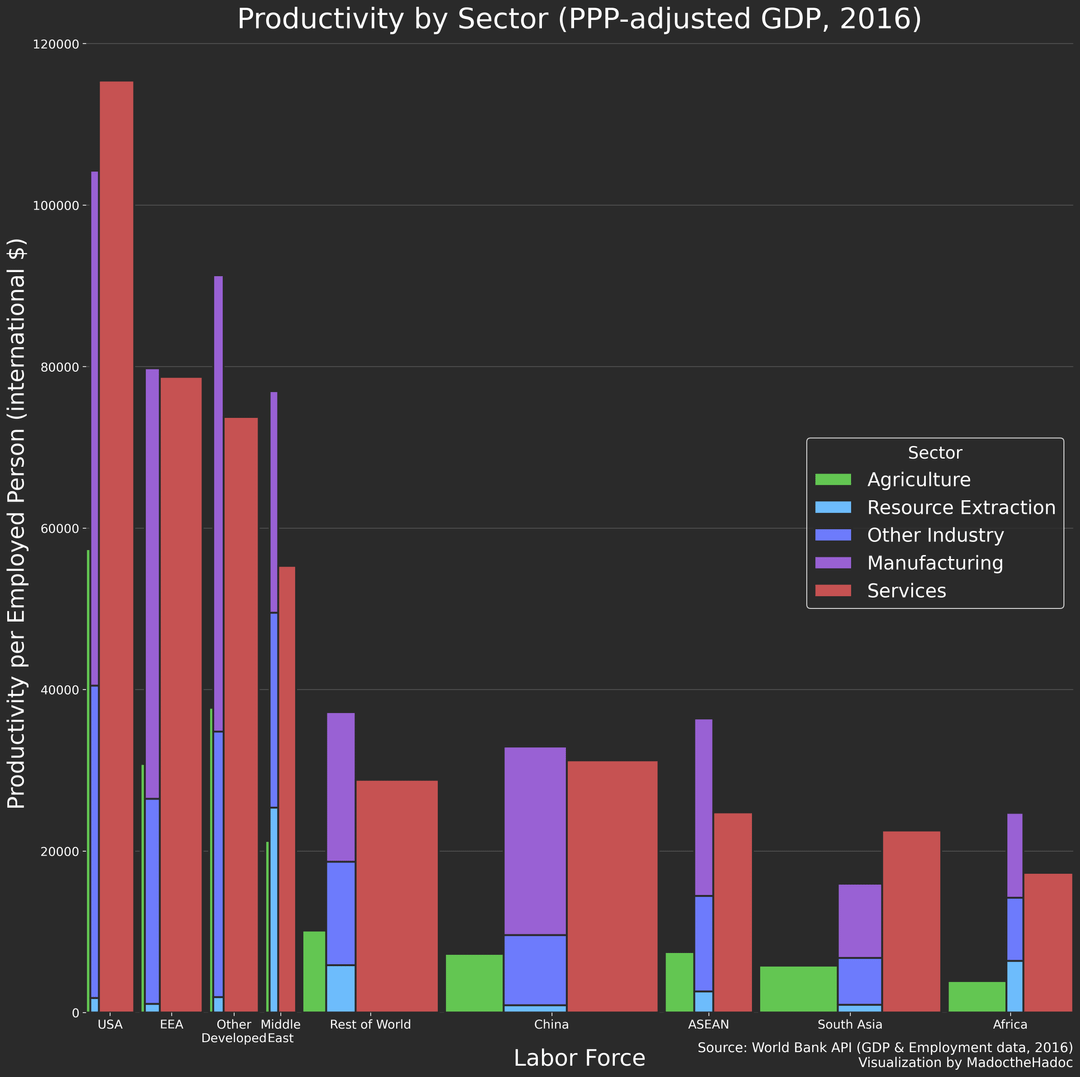
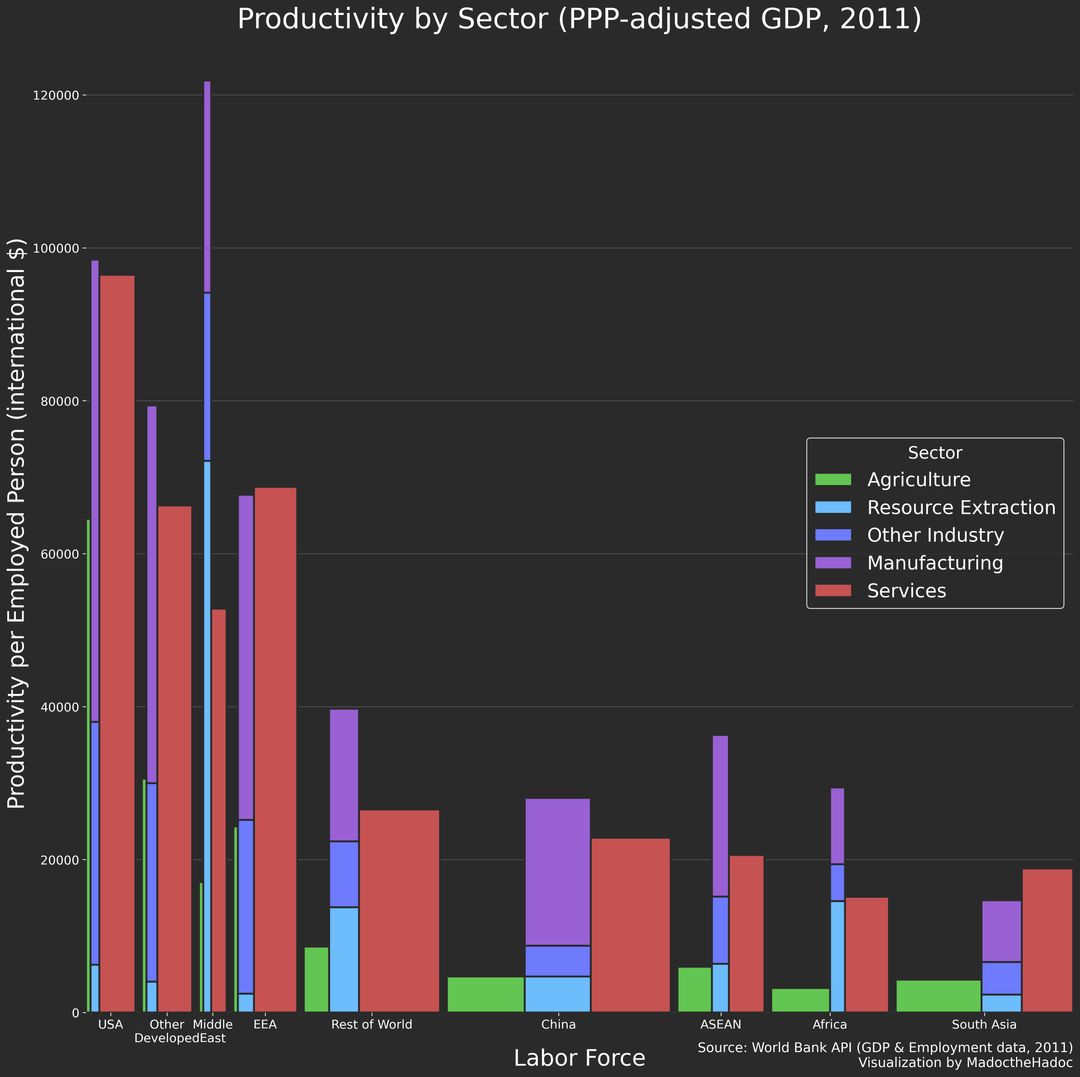
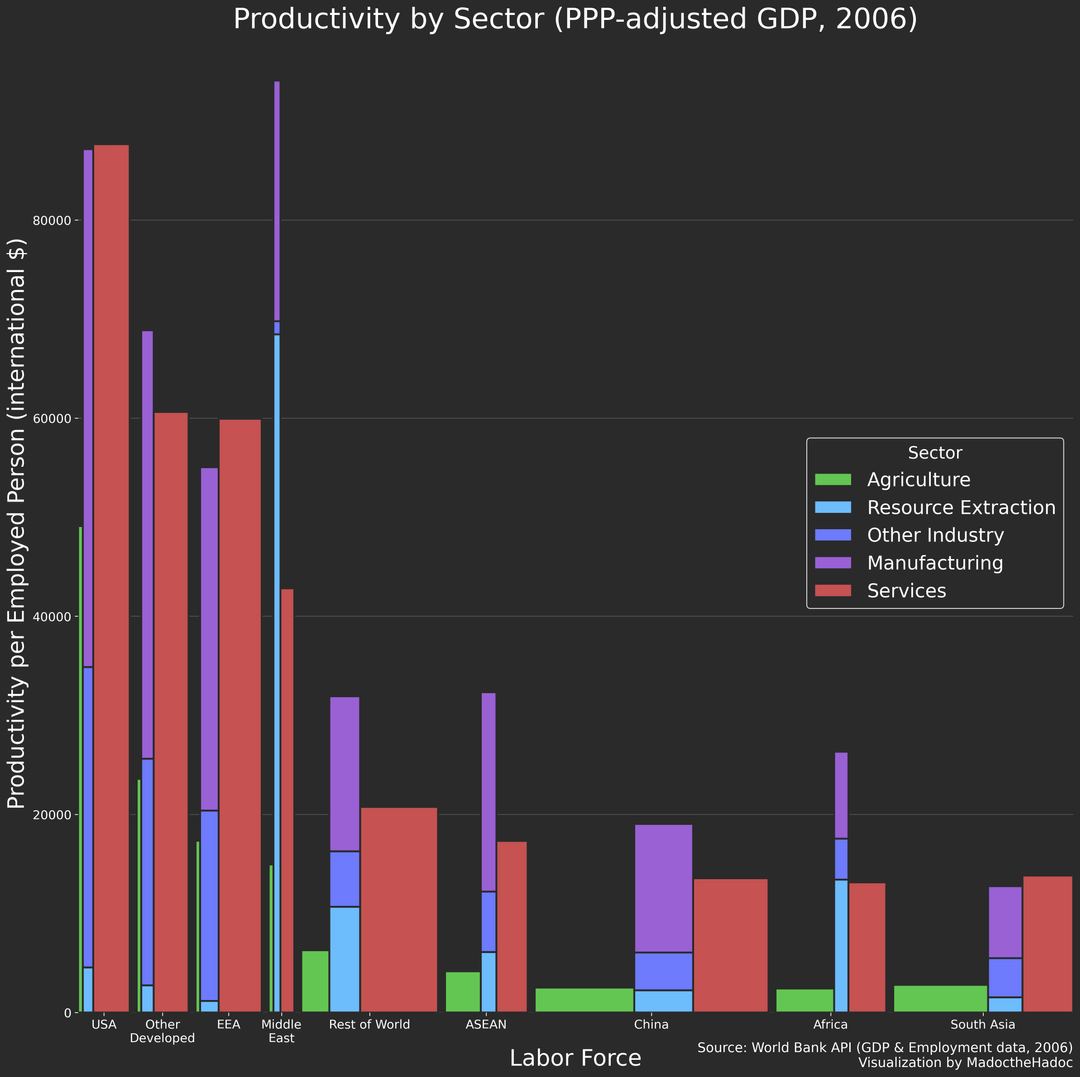
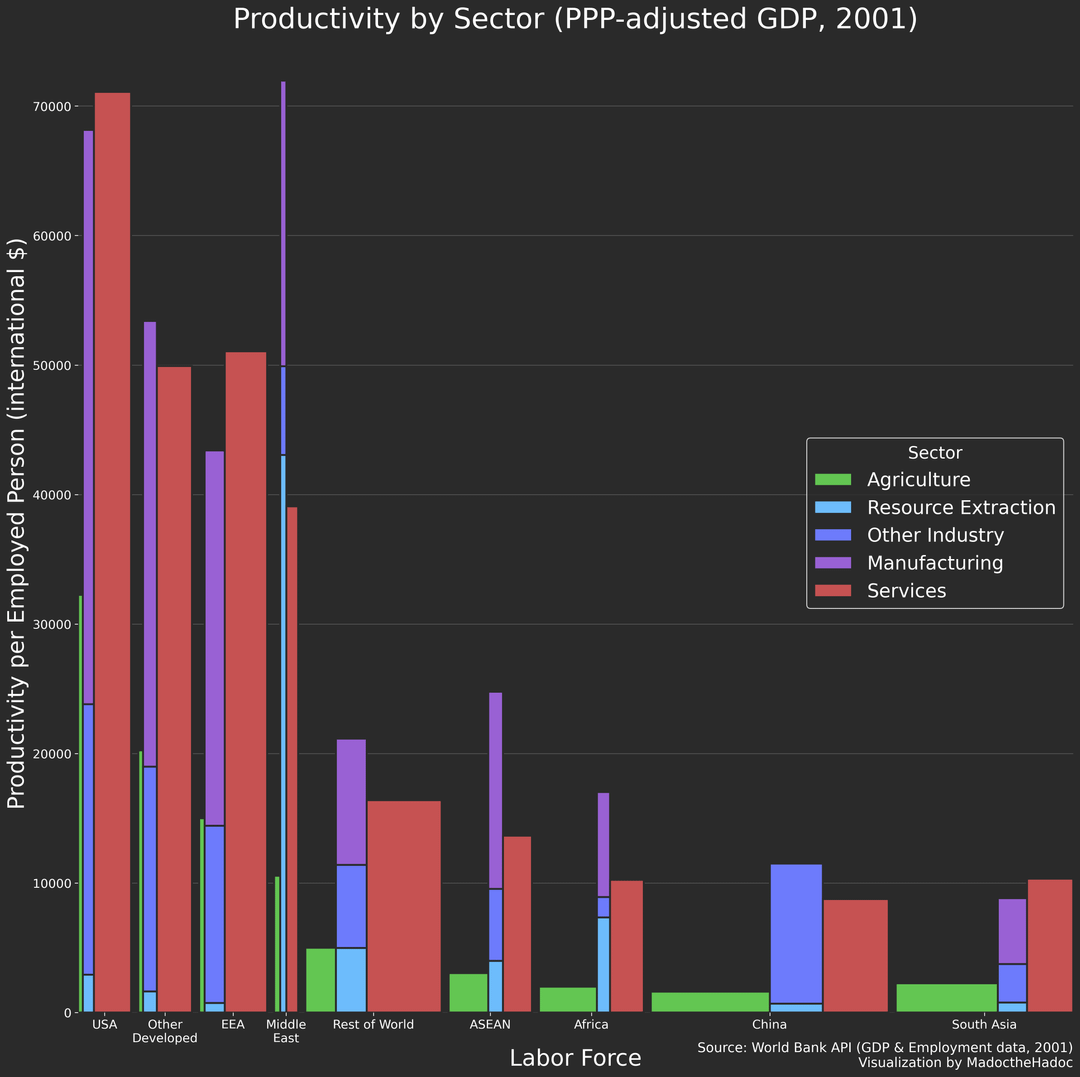
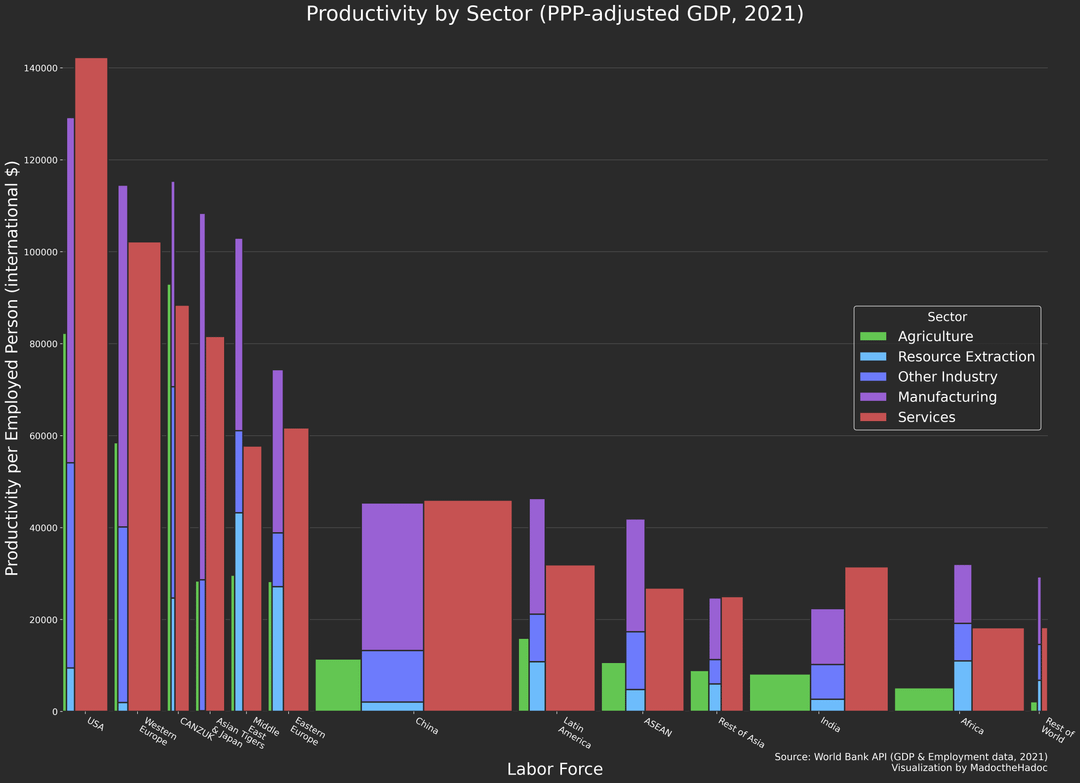
I read an article about the Indian economy recently which claimed that Indian service sector was more productive than its industrial base. That got me thinking about what the global distribution of these sectors would look like and that led me to the world bank API. I tried to extend this further back but we run out of data starting in the early 2000s.
These groupings are useful to understand global distribution of GDP PPP in various sectors of the economy, particularly industry. You can even see the resource trap over 20 years as extractive economies are beaten by manufacturing ones.
Some interesting features of this graph:
– Productivity in all sectors is higher in developed countries, mechanised agriculture is a wayyyy bigger deal than I thought even though it remains the least productive of the 3 sectors in every region.
– Africa and the Middle East have industrial sectors that are much more dependent on resource extraction than any other region.
– If China becomes as productive as Japan through the export-led manufacturing that made the country wealthy, it will be far and away the largest economy on Earth.
– American workers appear to produce much more than other developed economies, I looked more specifically and sometimes Scandinavia and the Netherlands can exceed sectoral productivity but for the most part the US. However "productivity" as it is traditionally used to mean GDP per hour worked is actually not the differential here, Americans mostly just work much more than other developed nations.
– GDP per capita is very closely correlated with service employment, countries industrialise by building up manufacturing capacity but eventually, economic growth comes from abandoning manufacturing and transitioning to a mostly service based economy.
– South Asia is very weird for having such a productive service sector.
Please lemme know what you think and how I can improve it
Posted by MadoctheHadoc
2 Comments
Really like the visual and use of area in the bar chart! I wish charting software had that capability by default, but none that I have experience with do so I’m guessing the graphic is custom?
Only feedback I have is that the stacking of the middle 3 groups doesn’t make sense to me. The way it’s graphed, it seems you’re saying all 3 groups have the exact same labor force numbers since they’re the same width.
Great visualization, would you care to share the data?
>South Asia is very weird for having such a productive service sector.
I can’t seem to see this in the graph. The productivity per employed person in South Asia seems to be lower than the ASEAN average and higher than the average of that for African countries.