Graphic by me, created in Excel.
All data from here: https://www.challengergray.com/blog/summer-lull-ends-july-job-cuts-spike-tech-ai-tariffs-blamed/
Posted by TA-MajestyPalm

![[OC] July 2025 US Layoffs vs 2024](https://www.byteseu.com/wp-content/uploads/2025/08/2mc7k2cfwyif1-1536x748.png "[OC] July 2025 US Layoffs vs 2024")
Graphic by me, created in Excel.
All data from here: https://www.challengergray.com/blog/summer-lull-ends-july-job-cuts-spike-tech-ai-tariffs-blamed/
Posted by TA-MajestyPalm
6 Comments
Required comment:
Graphic by me, created in Excel.
All data from here: https://www.challengergray.com/blog/summer-lull-ends-july-job-cuts-spike-tech-ai-tariffs-blamed/
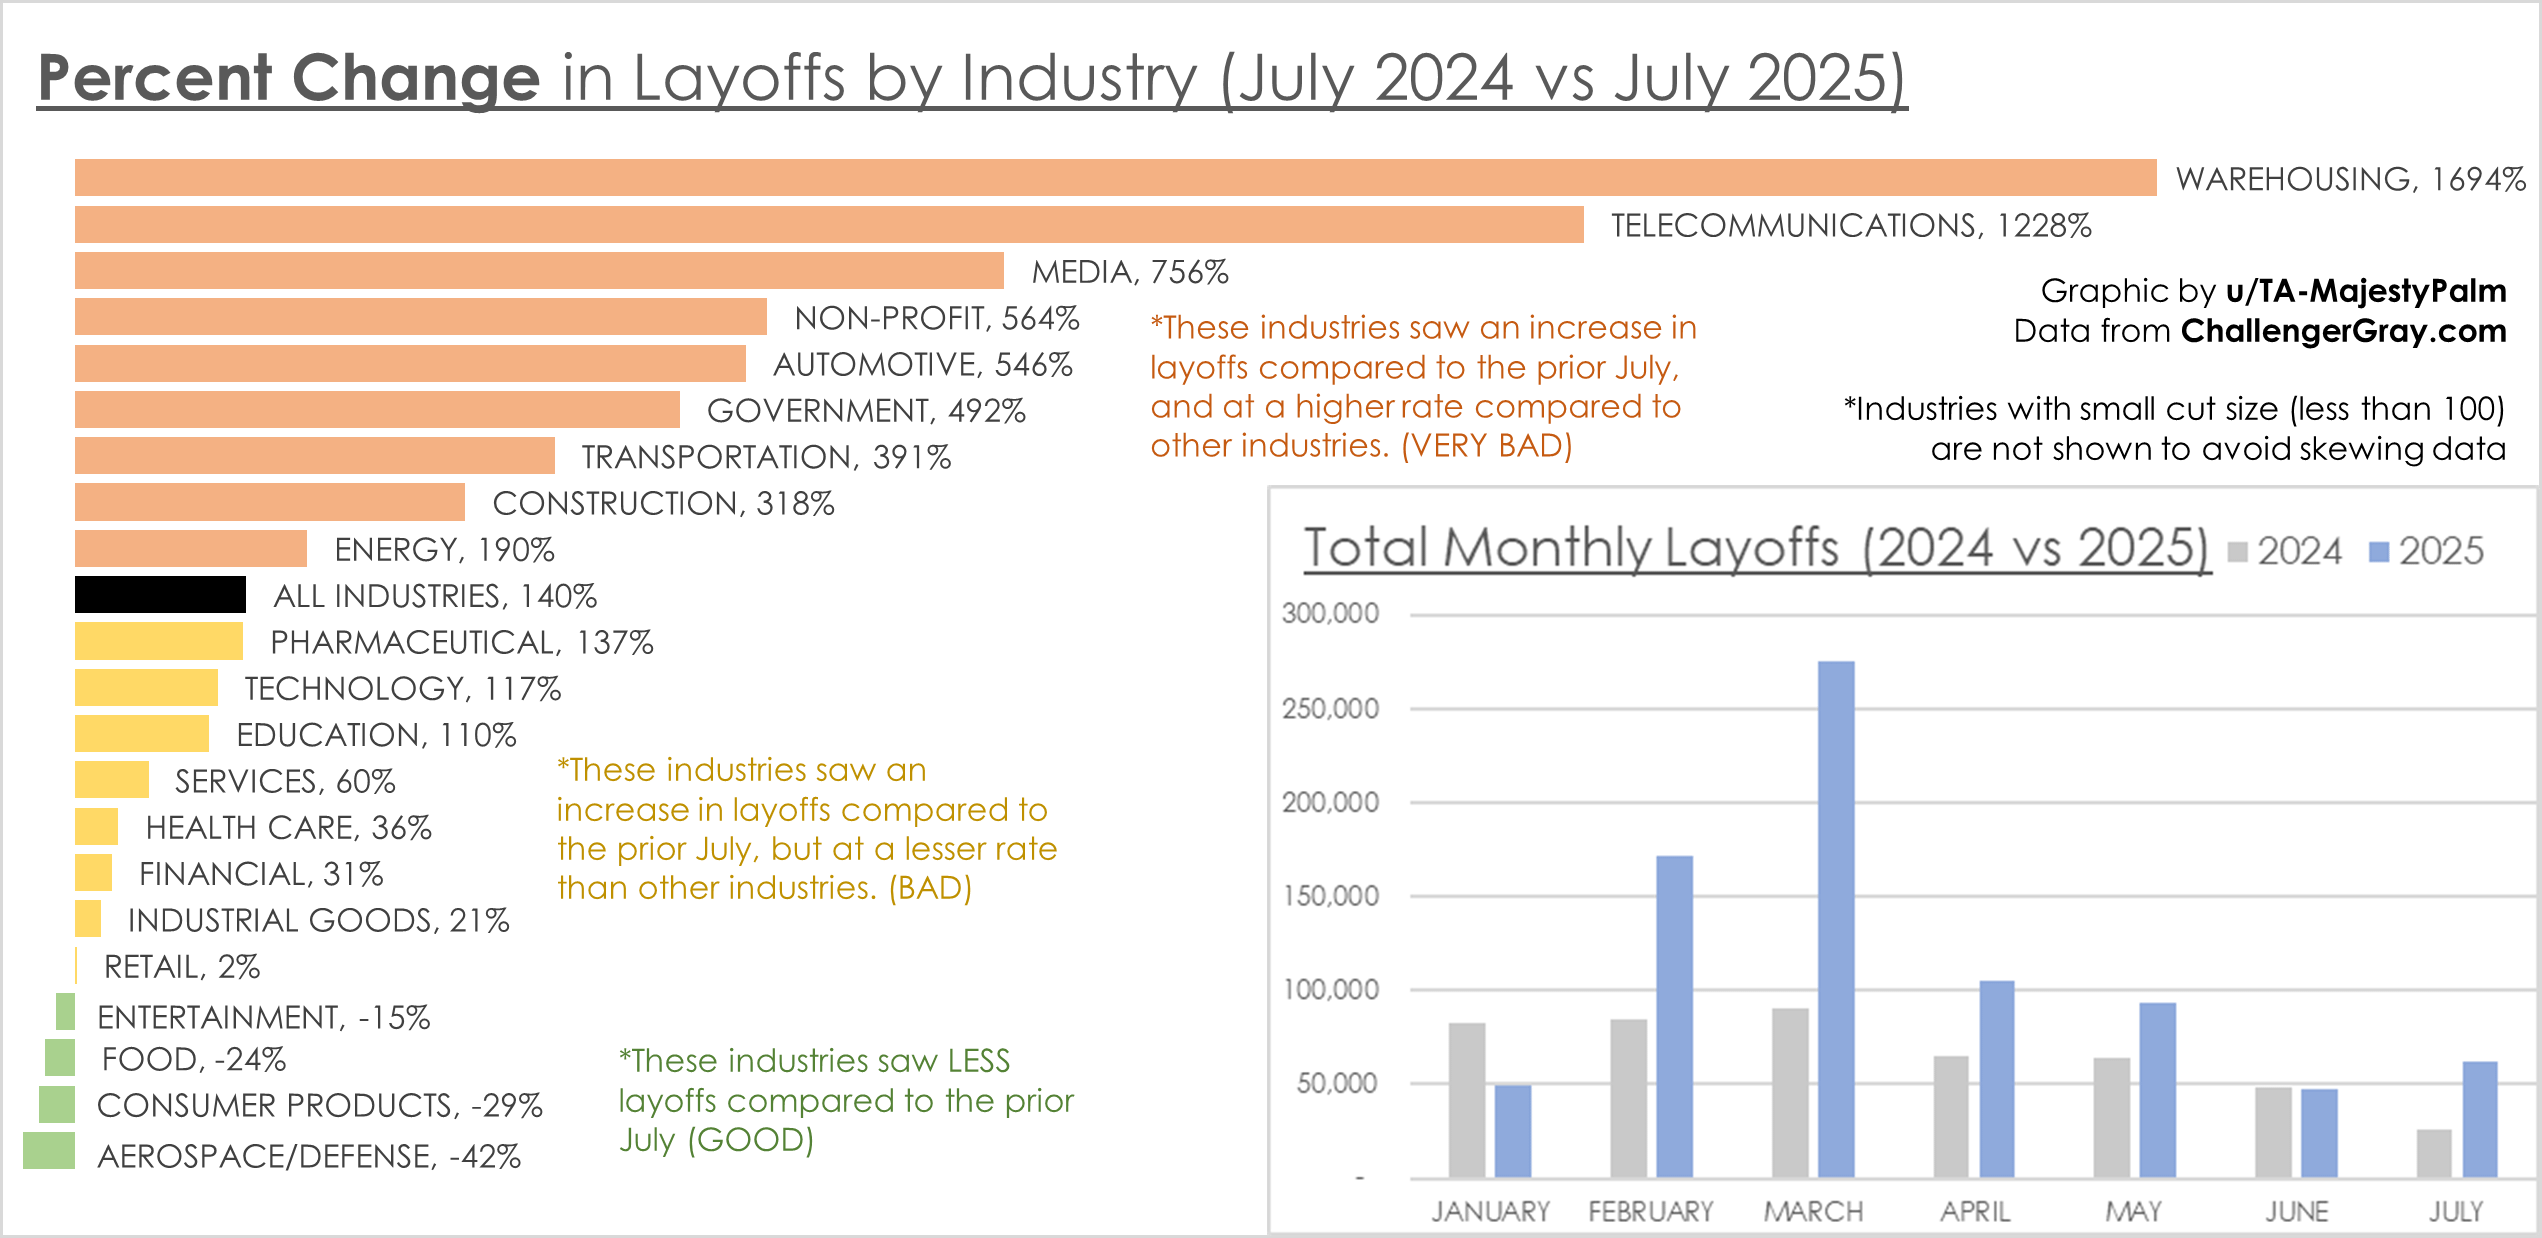
I’ve been seeing lots of layoffs in the news as well as hearing about it in my industry, and wanted to see what this looked like in data.
I created two graphics: One comparing increases in layoffs by industry compared to last July, and one comparing total monthly layoffs by month compared to last year.
Due to recent controversies I decided to use a different data source than the Bureau of Labor statistics since this data is very recent.
Layoffs reduced after Trump announced the first wave of tariffs? Am I reading that right?
Absolutely fascinating graph. I love the simplicity of it. And what a powerful picture it paints. The industry break down is a brilliant drilldown too.
Excellent work here!
In case anyone else was wondering about the telecom part:
The 1228% increase in layoffs specifically refers to the telecommunications sector, where U.S.-based employers announced 4,383 job cuts in July 2025 compared to just 330 in July 2024, according to data from Challenger, Gray & Christmas. This stark jump contrasts with the overall U.S. job cuts, which rose by a more modest 140% over the same period (from 25,885 to 62,075)
Some of the big moves in July in this industry:
Tata cut approximately 1,200-2,400 U.S jobs in July (12k worldwide)
U.S. Cellular acquisition by TMobile has cut over 4,000 jobs YTD. This is impacting the whole industry
AI. Fewer people have to take calls when you have chatbots answering calls.
Can confirm, I work in U.S. Defense and we are hiring like CRAZY. Come get a job lol.
It looks less dire when looking at the graph they have, another look is that layoffs have subdued a great bit since March (not sure if the March spike is mostly government or tariff worries).