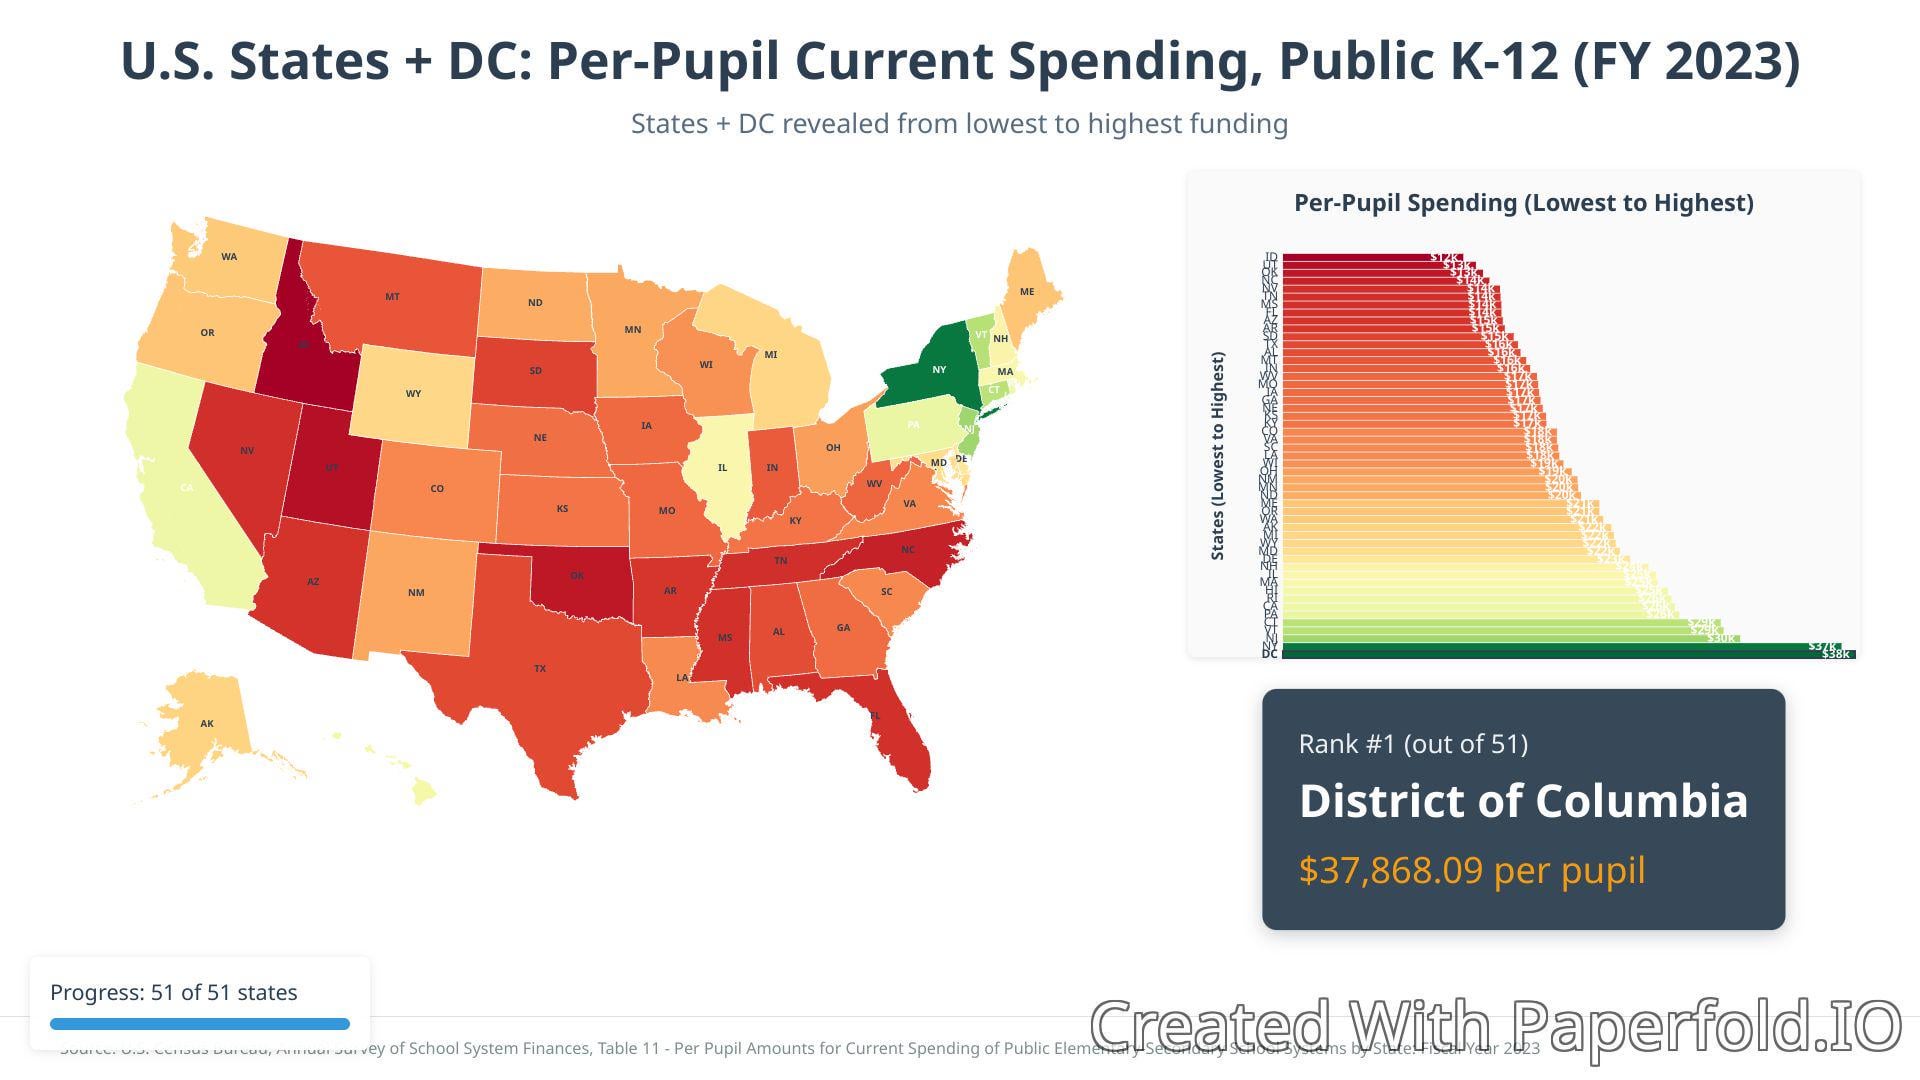
[OC] Education in USA is not uniform: DC spends $37,686 per student for Public K-12. Check out your state!!
Posted by ANTrixSTAR

![[OC] Education in USA is not uniform: DC spends $37,686 per student for Public K-12. Check out your state!!](https://www.byteseu.com/wp-content/uploads/2025/08/m23obktqftjf1-1536x864.jpeg "[OC] Education in USA is not uniform: DC spends $37,686 per student for Public K-12. Check out your state!!")
[OC] Education in USA is not uniform: DC spends $37,686 per student for Public K-12. Check out your state!!
Posted by ANTrixSTAR
39 Comments
I’d like to but I can’t see wtf it says because its small, squished, and low res
It’d probably more interesting to exclude DC. It only makes sense to compare DC vs. other cities.
US spends so much money per student and still have so little to show for it
This would be far more useful if it showed spending adjusted for the cost of living. (Also on a more granular level like county. Within a single state, cities can have a high cost of living and rural areas can have a low cost of living.)
New York and DC probably look high because they are mostly urban and are high cost of living areas.
You mean DC wastes tens of thousands of dollars per student per year
This might be insane but who would have thought it costs more to build, pay teachers, etc in more expensive places
Well done NC. Outspending Utah, Idaho and Oklahoma is an impressive feat. Many Oklahoma schools had to go to 4 day weeks because they couldn’t afford to keep them running 5 days a week.
Its interesting! It might be fun to correlate that to effective education (No idea how that could be tracked).
I think schools in my area got about $5500 per pupil. Homeschool kids were allotted $1400. On average, it appeared that less money = better results.
Of Course Mark Twain’s “Lies, damn lies , & statistics…” comes to mind.
Utah and Idaho are able to spend less because they have so many SAHM that help in the classroom. This would be more interesting to have literacy rates or graduation rates as well.
Spending doesn’t prove/show anything. You need a possible correlation to something else.
Ooh, small error, there are actually 50 states in America (j/k I know it’s counting DC as the 51st. Would that it were so)
More seriously, not sure I agree with the coloring; too much is red. And I don’t know if there is an industry accepted standard of what is “enough” (which is where imo the green cutoff should theoretically be).
1. This exact thing was posted a couple of days ago. Literally same info, same map.
2. Unless you can correlate that the money spent is leading to better outcomes (spoiler: it isn’t), the color gradient is backwards. Throwing money at something with no benefit is a bad thing.
It’s time to impose state-wide or federal-wide funding for public school education if equity is the goal.
City with expensive HCOL spends more than flyover states. More news at 11.
Dc really is like the capital from hunger games. Look at incomes there compared to everywhere else
Image compressed into oblivion ✅
Text too small to read ✅
Impossible to interpret if you’re colorblind ✅
If you throw in interpreting the size of irregular shapes and an x axis that doesn’t start at zero (you might already have that, it’s impossible to tell) you’ll hit the garbage visualization BINGO.
Goes to show money doesn’t equal quality schools. Washington D.C., in particular, doesn’t have good public schools. Ask anyone who’s lived there lol
I want to see this adjusted for cost of living, and then I want to see how the adjusted cost compares to outcomes.
I’d be more interested in distribution within the state. What kind of students is that money being spent on?
I’m actually surprised there aren’t bigger disparities in spending. Excluding NY and DC. I feel like property taxes are really high in NJ, and most goes to schools (and county taxes to law enforcement and courts), but spending per student isn’t all that much higher than in the low states.
Interestingly enough, there is very little correlation between school funding and student outcomes. Student outcomes *are* tightly correlated to parent’s socioeconomic status.
You should color them within a standard deviation with the median being a neutral color. You make it look like the entire country is underfunded.
The person who drew Michigan needed better art spending.
And by school district the difference is massive… metro Atlanta counties spend a fortune and rural counties spend nothing ( due to tax disparities) despite the massive amounts of welfare sent to rural areas
Great, now adjust it for cost of living and report back.
Utah: bottom 5 in spending per pupil, top 5 in education quality.
Red bad, Green good. More money good.
Alaska has to be inflated due to the cost of rural education, not a chance they are spending that much money, per student, on purpose.
Need to see by county. Urban areas pulling the average up for some states.
A private school education costs about 15,000 per year on average.
How the money is used is far more important than how much is spent
Wait till you find out how much it differs by on a school by school basis within states.
No wonder they’re trying to gut education lol, they need more stupid voters.
Can I get a correlation map between spending per student and 2024 Trump vote percentage? I’m guessing there’s a positive correlation.
Spending per pupil is irrelevant without testing scores/ graduation rate…
How much is spent isn’t the issue. Getting that value for the education is.
Don’t kid yourself. Look at the test scores and drop out rates in CA. More funding certainly doesn’t mean better outcomes.
Needs to be much more, significantly higher prep school tuition doesn’t even fully cover just a Day School’s operational budget for a year.
/r/peopleliveincities and therefore education is more expensive in states with high cost of living cities.
It is crazy that DC public schools spend more than the typical private school education per student.