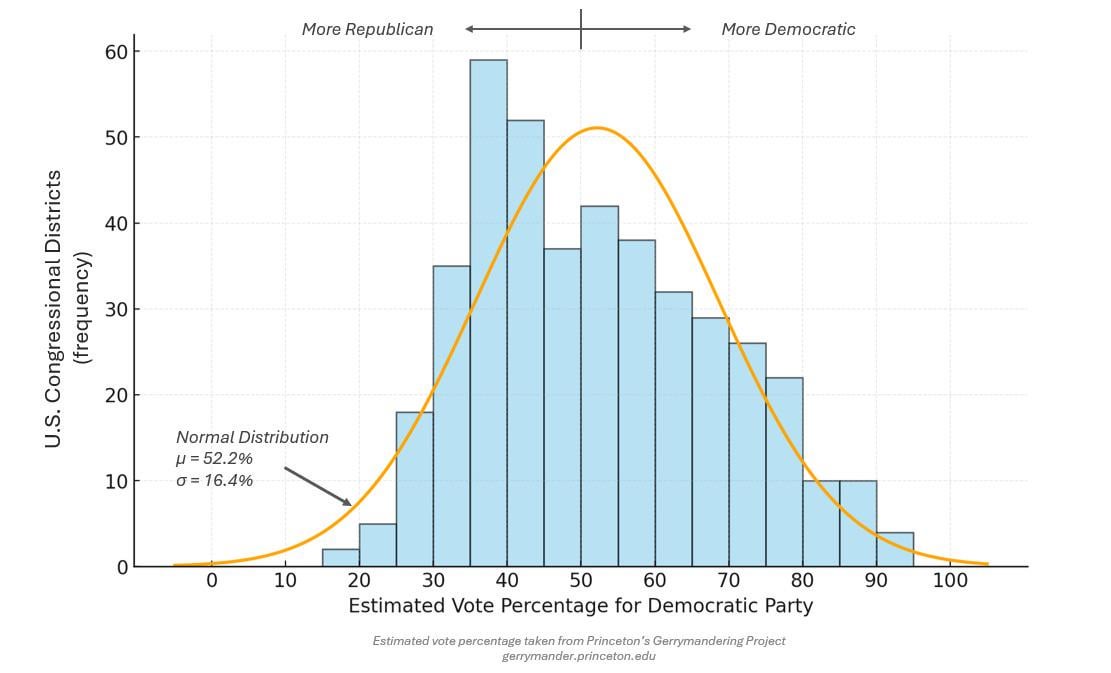
Gerrymandering in a graph, anticipated partisan voting share by congressional district [OC]
Posted by SaltyCompote

![Gerrymandering in a graph, anticipated partisan voting share by congressional district [OC]](https://www.byteseu.com/wp-content/uploads/2025/08/2uzbsxal21kf1-1024x620.jpeg "Gerrymandering in a graph, anticipated partisan voting share by congressional district [OC]")
Gerrymandering in a graph, anticipated partisan voting share by congressional district [OC]
Posted by SaltyCompote
10 Comments
Data taken from Princeton’s Gerrymandering Project (https://gerrymander.princeton.edu). Data not available for eight states (AK, DE, HI, ND, SD, VT, WV, WY). Created using GPT-5.
I wonder if a normal distribution is what would be expected with nonpartisan districting. I suspect it’d be more likely to be bimodal, with rural districts and urban districts having distinct peaks
This graph doesn’t show any indication of gerrymandering though. I just shows that there are more republican-leaning districts. That can also be explained simply by “that much more people voted republican than democrat.”
And others have already said: The assumption of normal distribution as a comparison is questionable.
Wait can you explain this graph? How is it showing gerrymandering, instead of showing a skew towards a higher portion of The district voting for Republicans?
Cool graphic! It would be nice to see how this aligns with packing vs. cracking. For example, is a district in which democrats win 35% of the vote considered cracked in favor of republicans, or packed in favor of democrats?
The answer is probably contextual for each state, so it might be hard to visualize in a graph like this.
Republicans don’t care about facts
I heard a story on NPR today where the expert said “Democrats have already reached they maximum potential to gerrymander outside California” because of states like New Mexico, Connecticut, and four or five others he listed.
there are lots of blue states that have indy restricting committees. Are those states going to gerrymander?
It’s a wonderful graph, but your point is better made by the inverse: estimated vote percentage for Republican Party. The existence of lots of districts that have just over 50% republican at the expense of the left and right side of the distribution is easy to see as republican gerrymandering.
Why does this graph assume a normal distribution of vote share across all districts? I don’t see any reason to assume that’s true. Look at Maryland, where democrats won every seat.
Moreover, why does this normal distribution believe that the democratic party should have an inbuilt vote advantage in the house? It seems to be centered around 50-55. But Republicans got more total votes for the house in the last election and democrats routinely get less than 50%.
In 2024 democrats got 47.2%.
If you slide the curve one ‘bar’ to the left to be where you’d expect it to be going off of national averages it would look very different.
That said, I don’t see any reason to suppose a normal distribution is appropriate here. The cities are heavily democratic, which means anything that is built on compactness is going to lead to more very heavily democratic districts, and more ‘just barely republican’ districts if we factor in that republicans have slightly more votes in the house overall.