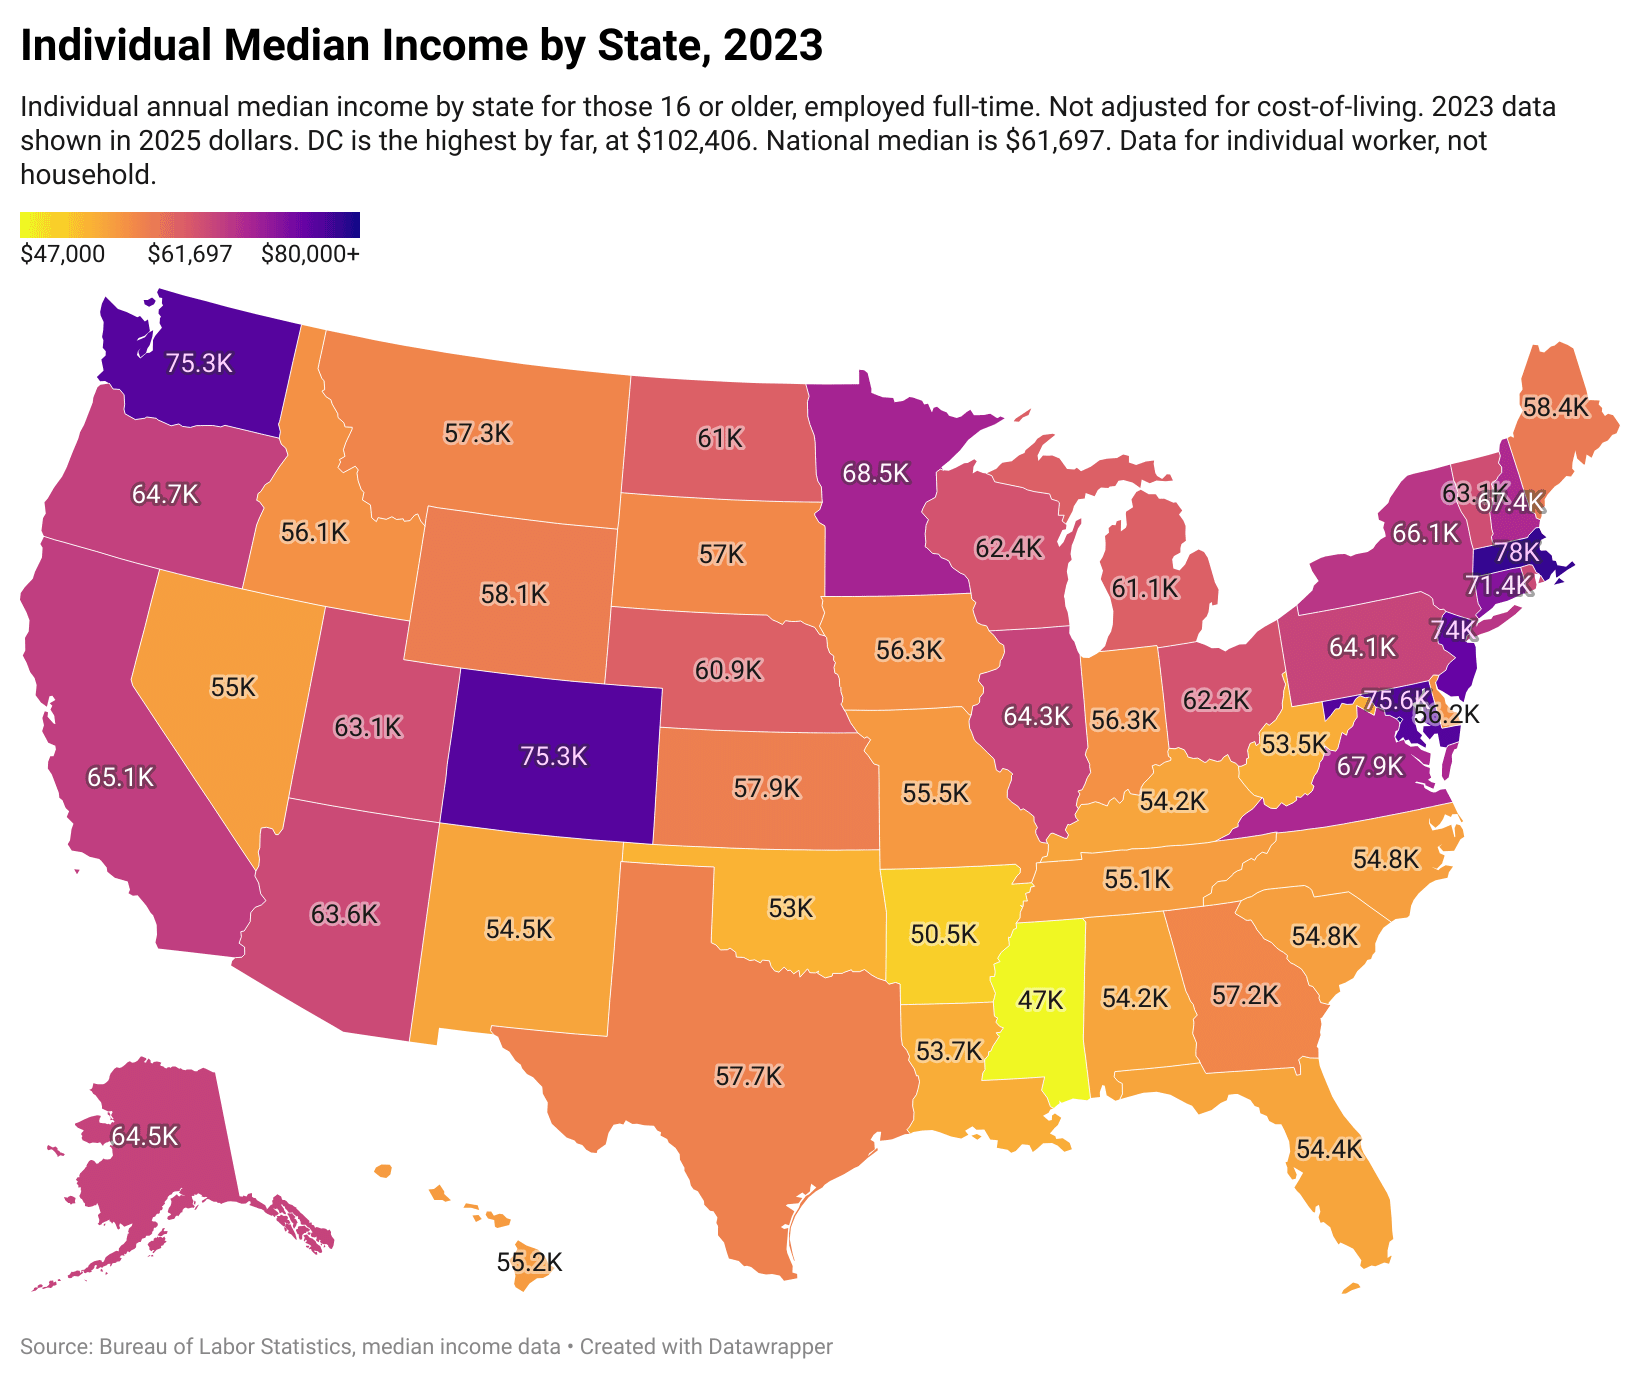
Individual median income by state for all full-time workers. Median income data was extracted from table 3 of the following article from the Bureau of Labor Statistics. Even though it says “women earnings” the specific table used is for all workers of both sexes. Author calculations done using CPI data to show 2025 dollars. [https://www.bls.gov/opub/reports/womens-earnings/2023/](https://www.bls.gov/opub/reports/womens-earnings/2023/). Datawrapper used to map.
asterios_polyp on
Can anyone explain Colorado?
equalhater on
Doesn’t tell you the full picture. Could be more interesting when you factor the take home median, the cost of living and miscellaneous state taxes such as property and auto taxes.
ChallengingMyOpinion on
Ohio being above NC in some ways is really shocking and in other ways not so much.
MuhamedBesic on
Rhode Island once again forgotten 😔
nick1812216 on
$65.1k in CA? I call BS! I invoke BS! That’s impossible
KR1735 on
I feel like I’ve seen this pattern before.
sarcasticorange on
Florida is always oddly skewed on these things due to all of the retirees who have wealth, but not much income.
ibeerianhamhock on
Nothing terribly surprising here. Glad you included DC, I didn’t see the number on the map so initially thought you’d left it out and I expected it be the highest (which it is)
cowboysmavs on
Most of the rust belt being so high and equaling Cali is definitely wild. But their dollar goes way further too.
stickayrickay on
My wife and I live in Nevada, together we make almost 5x the median income. Somehow, we’re still poor.
hurricanemitch on
“Not adjusted for cost of living” should be in bold type and 20 times larger size
FrostnJack on
Huh? You can’t afford rent in CA until $92K. 🤷🏼♂️I dunno, I give up on math.
liquidsol on
It seems that Alabama is always either the best or worst at something in every color coded map on this sub.
Impressive_Flan3935 on
Jesus christ. I am above average and I cn barely make ends meet with just one kid. How do ppeople get by?
FCguyATL on
Now do it vs cost of living
ChicagoNurture on
The cost of living has been eliminated.
CmdrMcLane on
Americans have no idea how much more money they now make than the average European. Even Mississippi is now above the EU average.
jrralls on
Why is it so expensive to retire to Hawaii? If it’s medium income isn’t really that high?
Niauropsaka on
Oh. “Employed full-time.” Pfft.
El_Bean69 on
God I’m so far behind in Colorado man I need to do better
Responsible-Scar-980 on
Wait. Reddit had me convinced that every single person living in California was a software engineer making 900k a year working 12 hours a month. This graph lies.
spaceninj on
People talk about our Southern border, but the real wall needs to be built around New Jersey.
It’s a parasite state. It leeches off NY in the North and Philly in the South. It takes money from those states and moves it over the border.

![[OC] Individual Median Income by State, 2023](https://www.byteseu.com/wp-content/uploads/2025/09/j0l2x2ccygmf1-1536x1292.png "[OC] Individual Median Income by State, 2023")
23 Comments
Individual median income by state for all full-time workers. Median income data was extracted from table 3 of the following article from the Bureau of Labor Statistics. Even though it says “women earnings” the specific table used is for all workers of both sexes. Author calculations done using CPI data to show 2025 dollars. [https://www.bls.gov/opub/reports/womens-earnings/2023/](https://www.bls.gov/opub/reports/womens-earnings/2023/). Datawrapper used to map.
Can anyone explain Colorado?
Doesn’t tell you the full picture. Could be more interesting when you factor the take home median, the cost of living and miscellaneous state taxes such as property and auto taxes.
Ohio being above NC in some ways is really shocking and in other ways not so much.
Rhode Island once again forgotten 😔
$65.1k in CA? I call BS! I invoke BS! That’s impossible
I feel like I’ve seen this pattern before.
Florida is always oddly skewed on these things due to all of the retirees who have wealth, but not much income.
Nothing terribly surprising here. Glad you included DC, I didn’t see the number on the map so initially thought you’d left it out and I expected it be the highest (which it is)
Most of the rust belt being so high and equaling Cali is definitely wild. But their dollar goes way further too.
My wife and I live in Nevada, together we make almost 5x the median income. Somehow, we’re still poor.
“Not adjusted for cost of living” should be in bold type and 20 times larger size
Huh? You can’t afford rent in CA until $92K. 🤷🏼♂️I dunno, I give up on math.
It seems that Alabama is always either the best or worst at something in every color coded map on this sub.
Jesus christ. I am above average and I cn barely make ends meet with just one kid. How do ppeople get by?
Now do it vs cost of living
The cost of living has been eliminated.
Americans have no idea how much more money they now make than the average European. Even Mississippi is now above the EU average.
Why is it so expensive to retire to Hawaii? If it’s medium income isn’t really that high?
Oh. “Employed full-time.” Pfft.
God I’m so far behind in Colorado man I need to do better
Wait. Reddit had me convinced that every single person living in California was a software engineer making 900k a year working 12 hours a month. This graph lies.
People talk about our Southern border, but the real wall needs to be built around New Jersey.
It’s a parasite state. It leeches off NY in the North and Philly in the South. It takes money from those states and moves it over the border.
Build the wall and have New Jersey pay for it!