
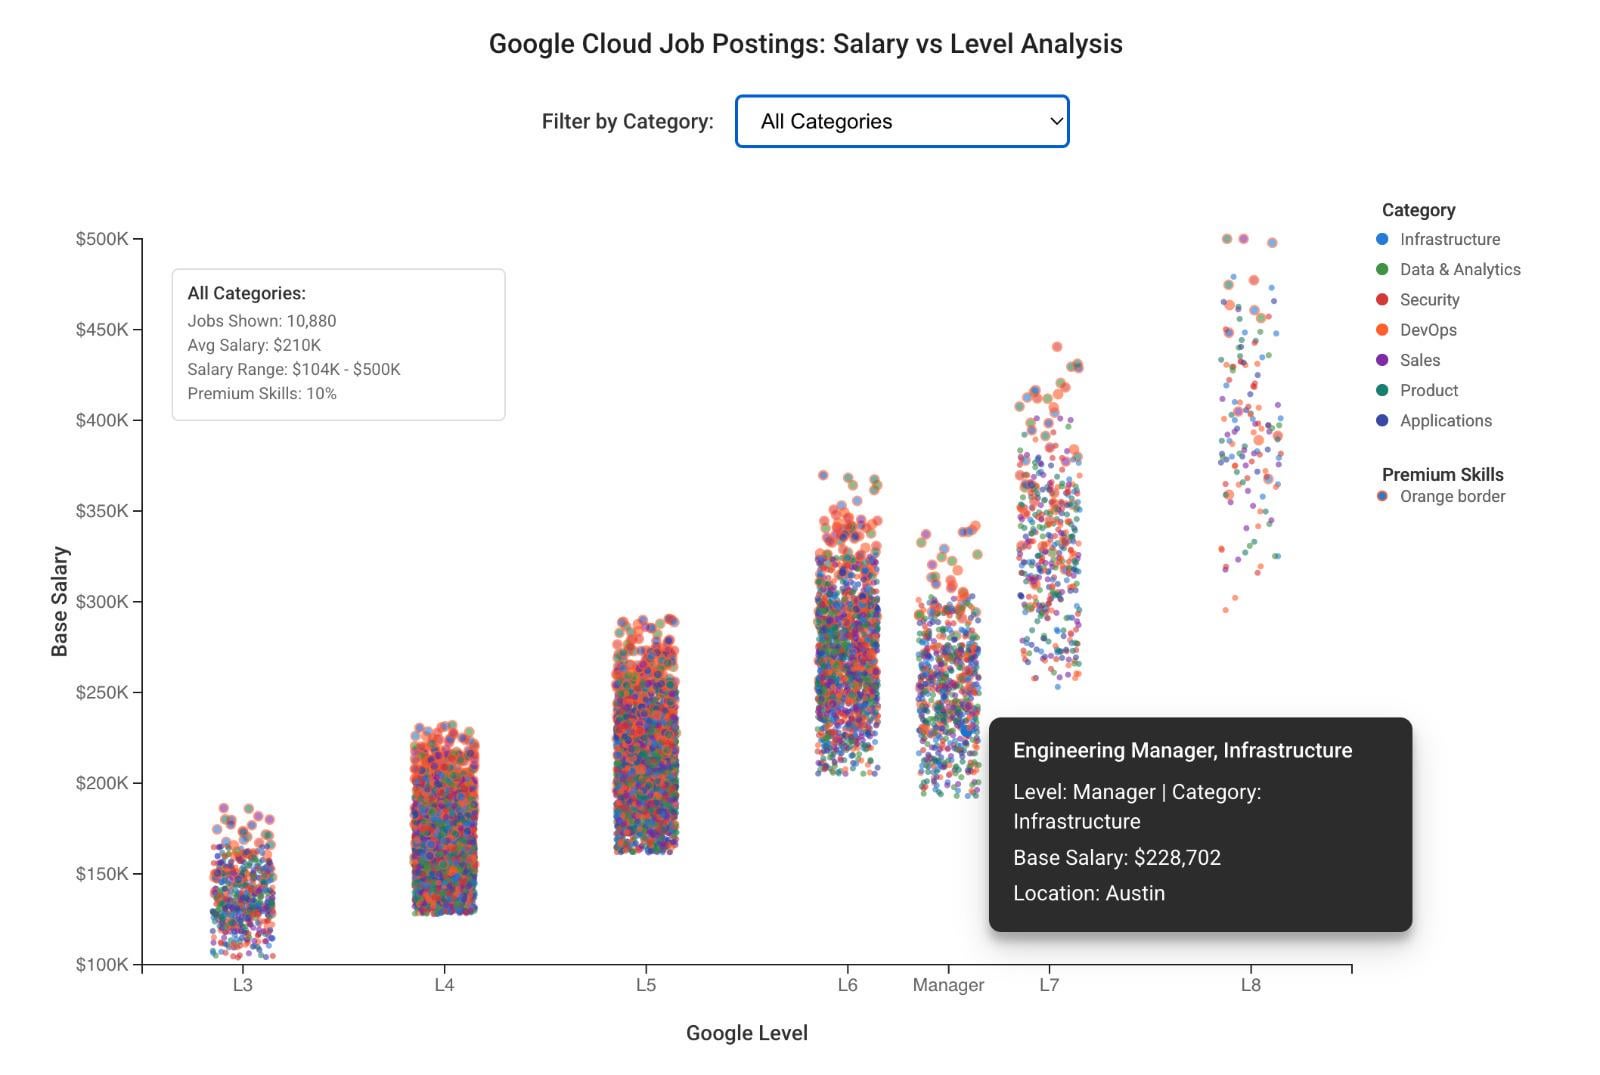
![[OC] Google Cloud salary scatter plot: 10,880 job postings show L8 Principal roles hitting $421K base while L3-L5 cluster tightly. Premium skills (orange borders) create salary outliers at every level.](https://www.byteseu.com/wp-content/uploads/2025/09/f2caglqr5pmf1-1536x1032.jpeg "[OC] Google Cloud salary scatter plot: 10,880 job postings show L8 Principal roles hitting $421K base while L3-L5 cluster tightly. Premium skills (orange borders) create salary outliers at every level.")
Data Source:
Google Cloud job postings from June-August 2025, extracted from BigQuery jobs database. Interactive scatter plot shows 10,880 individual data points with salary vs level distribution across 7 technology categories.
Tools Used:
- D3.js for interactive scatter plot with category filtering and hover tooltips
- Python for realistic salary data generation based on Google's L3-L8 leveling system
- Material Design styling with proper axis labeling and legend
Methodology:
- Each dot represents one job posting with base salary (85% of posted maximum) plotted against Google level (L3-L8 + Manager)
- Color coding by technology category (Infrastructure, Data & Analytics, Security, DevOps, Sales, Product, Applications)
- Orange borders indicate premium skills roles (PhD Research, Security Clearance, AI/ML expertise) with 15-25% salary premiums
- Slight horizontal jitter added for better visualization of overlapping data points
Key Insights:
- Clear salary bands: Distinct compensation tiers by level with realistic variance within each band
- Premium skill impact: Orange-bordered dots show salary outliers at every level, not just senior roles
- L8 ceiling: Principal roles cap around $421K base, creating visible salary ceiling in upper right
- Category clustering: Security and Data & Analytics roles (red/green dots) trend toward higher compensation
- Experience premiums: Wider salary spread at L6+ levels shows location and skills impact on compensation
Technical Notes:
- Interactive tooltips show job title, level, category, base salary, location, and premium skills status
- Category filter dropdown allows focused analysis of specific technology domains
- 10,880+ individual data points with realistic salary variance and geographic premiums built into distribution
Full interactive scatter plot: https://storage.googleapis.com/gcp-final-scatter-jan2025/index.html
Posted by aaghashm
2 Comments
Data Source: Google Cloud job postings June-August 2025 from BigQuery jobs database. Each of 10,880 dots represents one job posting with base salary vs Google level.
Methodology: Base salary calculated as 85% of posted maximum compensation. Color coding by technology category. Orange borders indicate premium skills roles (PhD Research, Security Clearance, AI/ML) with 15-25% salary boosts.
Key Patterns: Clear salary bands by level, premium skills create outliers at every level, L8 roles cap around $421K base, Security/Data Analytics trend higher, wider spread at L6+ shows location/skills impact.
Interactive Features: Hover tooltips show job title/location/skills, category filter dropdown for focused analysis of specific domains.
Full interactive scatter plot: [https://storage.googleapis.com/gcp-final-scatter-jan2025/index.html](https://storage.googleapis.com/gcp-final-scatter-jan2025/index.html)
Needs jitter to communicate anything indicated by the legend