
![[OC] Social Security Disability Insurance Recipients as Percentage of Pop. Younger Than 65 By State (2022)](https://www.byteseu.com/wp-content/uploads/2025/09/uy65m94j89nf1-1536x1075.png "[OC] Social Security Disability Insurance Recipients as Percentage of Pop. Younger Than 65 By State (2022)")
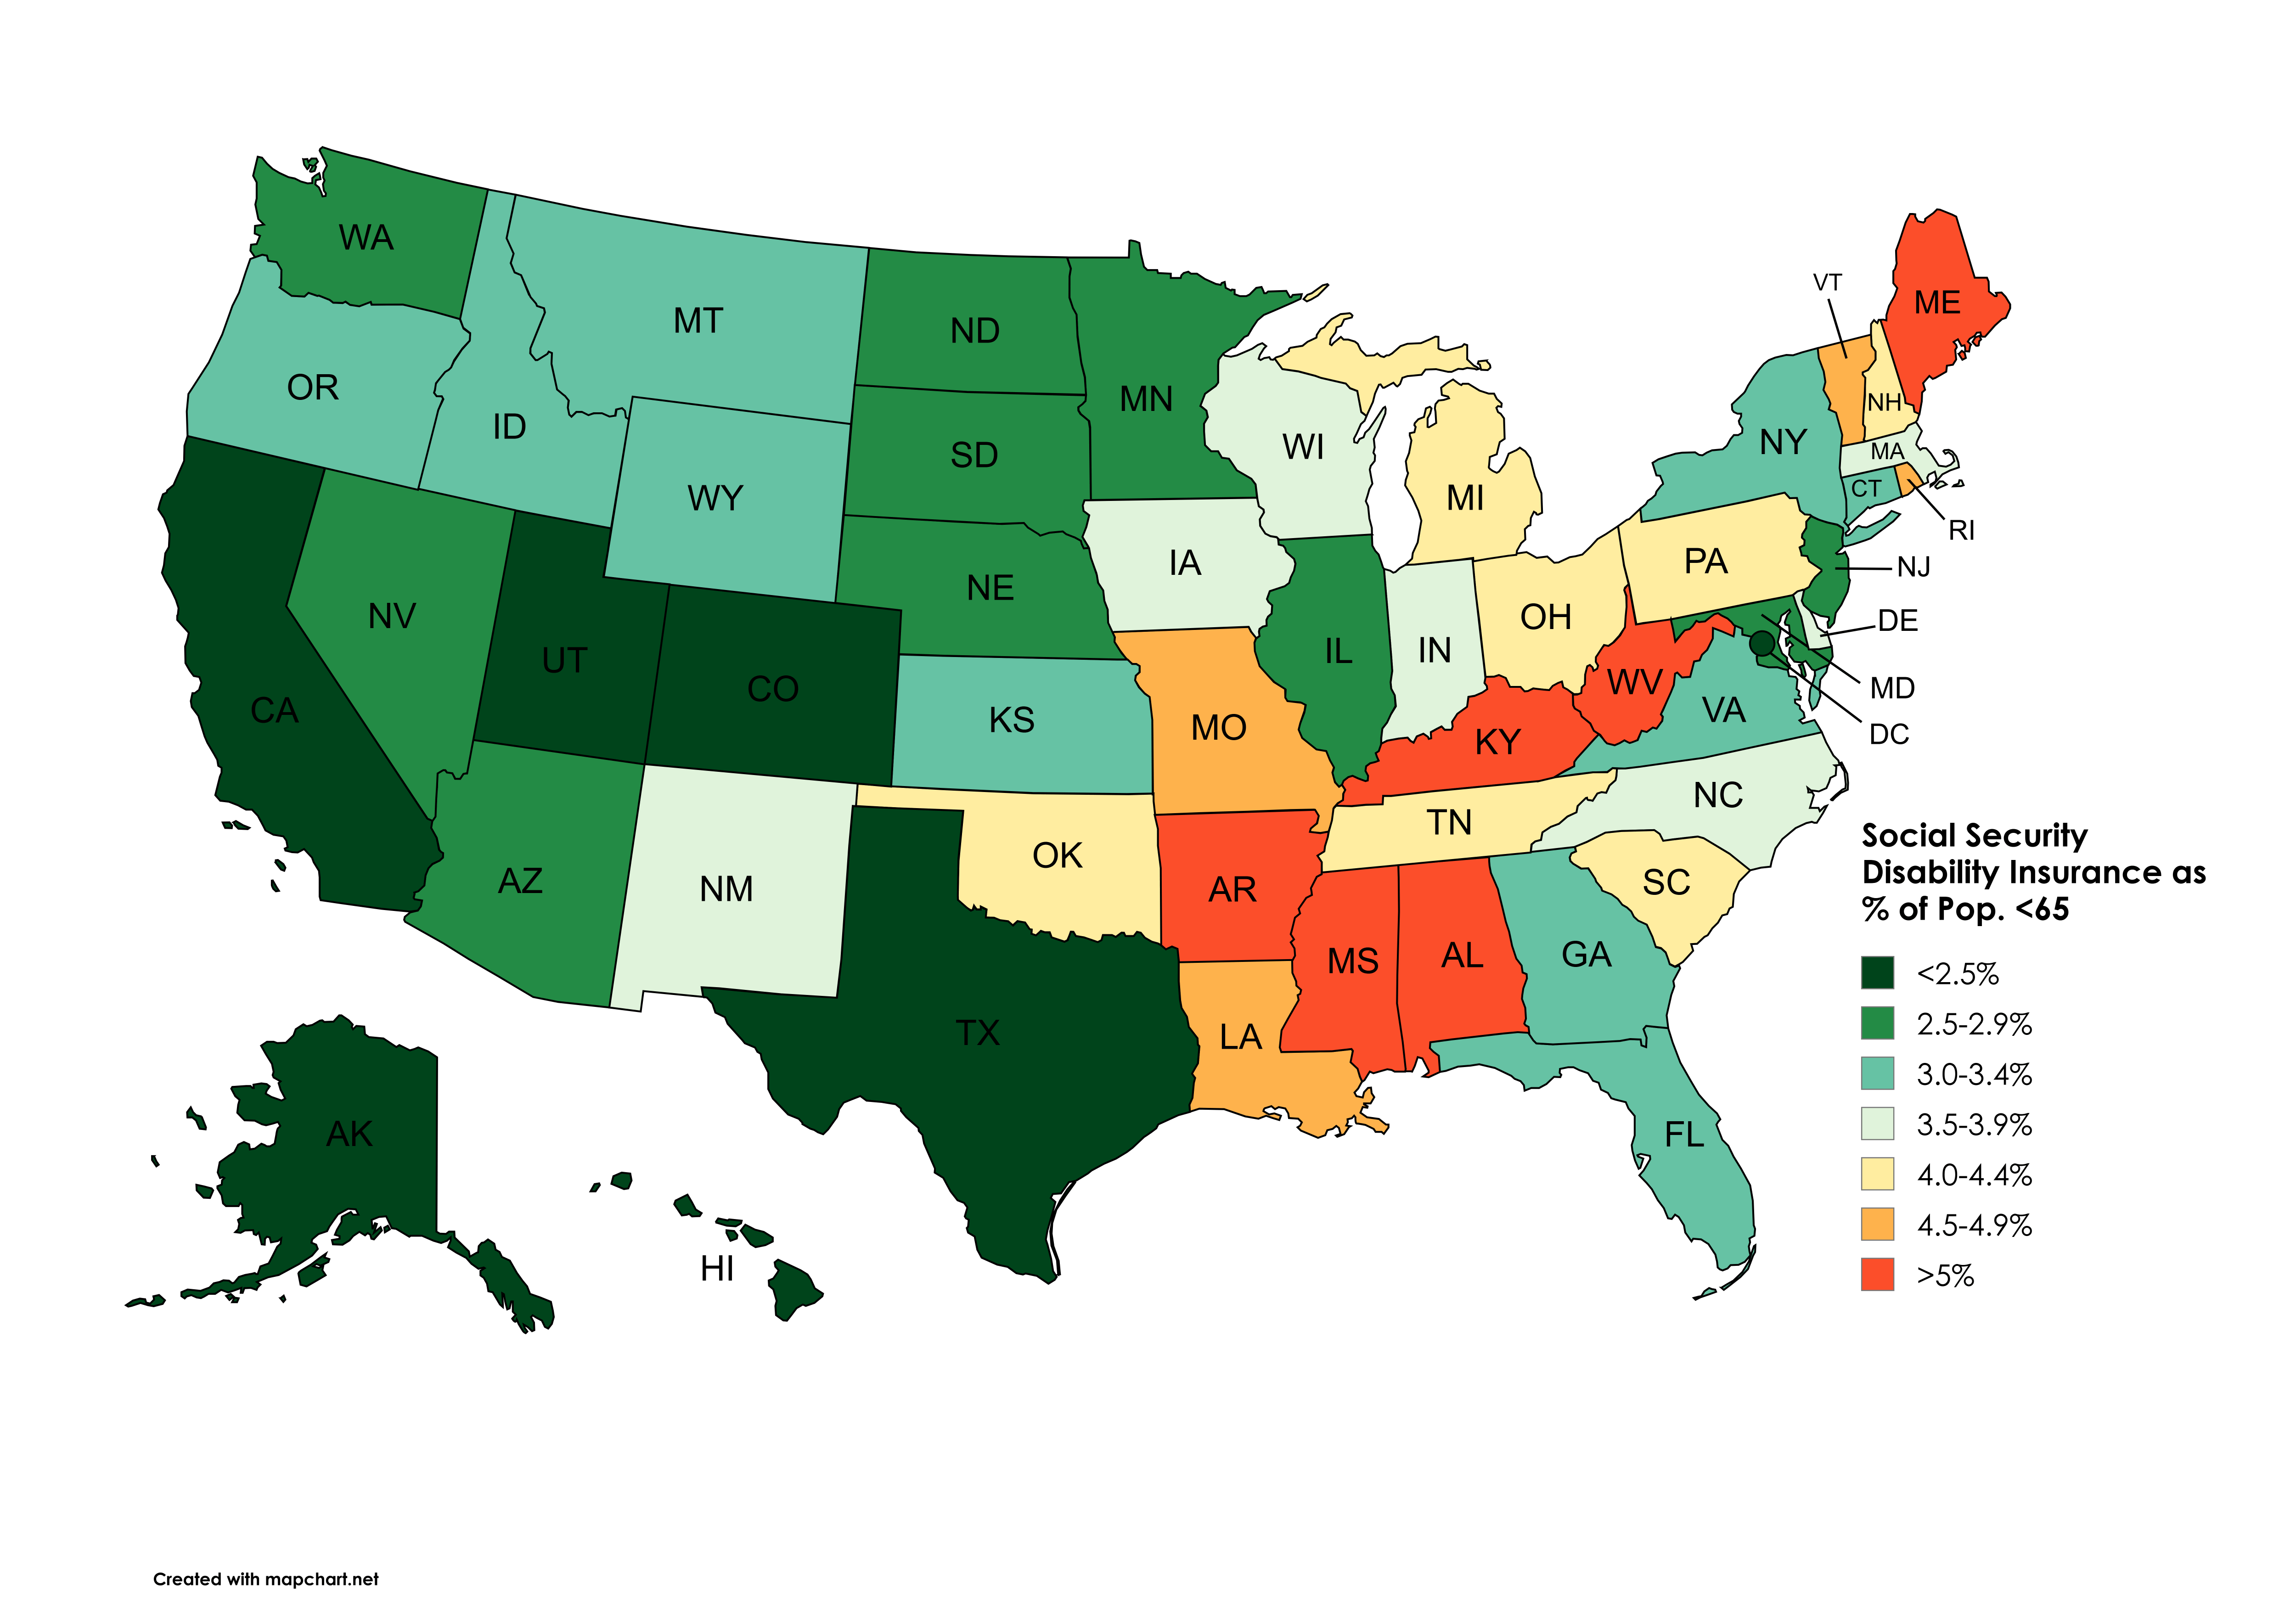
Data: Social Security Administration, Annual Statistical Report on the Social Security Disability Insurance Program, 2022 (Table 9). Social Security Administration, Annual Statistical Report on the Supplemental Security Income Program, 2022 (Tables 10 and 16). KFF State Health Facts, Population Distribution by Age.
Tool: Mapchart.net
Posted by snakkerdudaniel
16 Comments
Data: Social Security Administration, Annual Statistical Report on the Social Security Disability Insurance Program, 2022 (Table 9). Social Security Administration, Annual Statistical Report on the Supplemental Security Income Program, 2022 (Tables 10 and 16). KFF State Health Facts, Population Distribution by Age.
Tool: [Mapchart.net](http://Mapchart.net)
So does this mean the South won’t rise again?
Just shows it is better West of the Mississippi:)
I get the south, but why Maine?
Of course these moocher red states
Is this population of the state adjusted? Meaning CA and Texas would have a higher population than WV and therefore the numbers would appear lower for larger population states?
The Appalachian mountains cause disability (claims)
Maine has fewer young people accounting for the high %. I’m not surprised by the Southern States. Does this correlate?
State Overweight Rates (2023)
Based on data from the Centers for Disease Control and Prevention (CDC), the following states have the highest rates of overweight adults:
West Virginia: 41.2%
Mississippi: 40.1%
Arkansas: 40.0%
Louisiana: 39.9%
Alabama: 39.3
Maine being high up there is surprising
Poverty makes people disabled
https://preview.redd.it/jbe6q8sjd9nf1.png?width=2907&format=png&auto=webp&s=90a038dd82a37690e85de4cfabfebaa1c5f9f40e
Maine is the outlier here. I [asked Copilot why (sources included](https://copilot.microsoft.com/shares/6XCD6ouzBzfLy5jvdJR6a), though I did not fact check – TLDR:
* Maine’s **oldest population*** and **high rural-occupation** base drive disability prevalence.
* **Robust outreach** through DHHS and local agencies boosts SSDI application rates.
* **State SSI supplements** cushion income, so many recipients avoid crossing into official poverty.
^(*Maine has the nation’s oldest age profile: nearly 22 percent of Mainers are 65 or older, compared with about 17 percent nationally.)
GOP insists the freeloaders are in the house with them right now… but they keep voting for them anyway 🤷♂️
It’s pretty difficult to take anything from this graph without looking at age distributions within the state.
For instance, Colorado had a ton of migration into it over the past several years. Those that move are more likely to be younger and/or healthier, so it’s no surprise that state is now on the “better” end of the spectrum.
Oh all the states complaining about “welfare”. Boy, I’d have never guessed! (jk ofc its these idiots)
Now you see why they call them red states. Government money for me, not for thee.
Am I the only one who straight away zoomed in to RI and then was shocked they were not a higher percentage?
A lot of people forget or aren’t aware of the number of factories in the south. They aren’t good on the human body. And they put them in the south because that’s where the most uneducated people are. Pays well, but fucks up your body. A lot of people are on disability after years of factory work.