Data: IIHS (Insurance Institute for Highway Safety): https://www.iihs.org/research-areas/fatality-statistics/detail/state-by-state
Tool: Mapchart.net
Posted by snakkerdudaniel

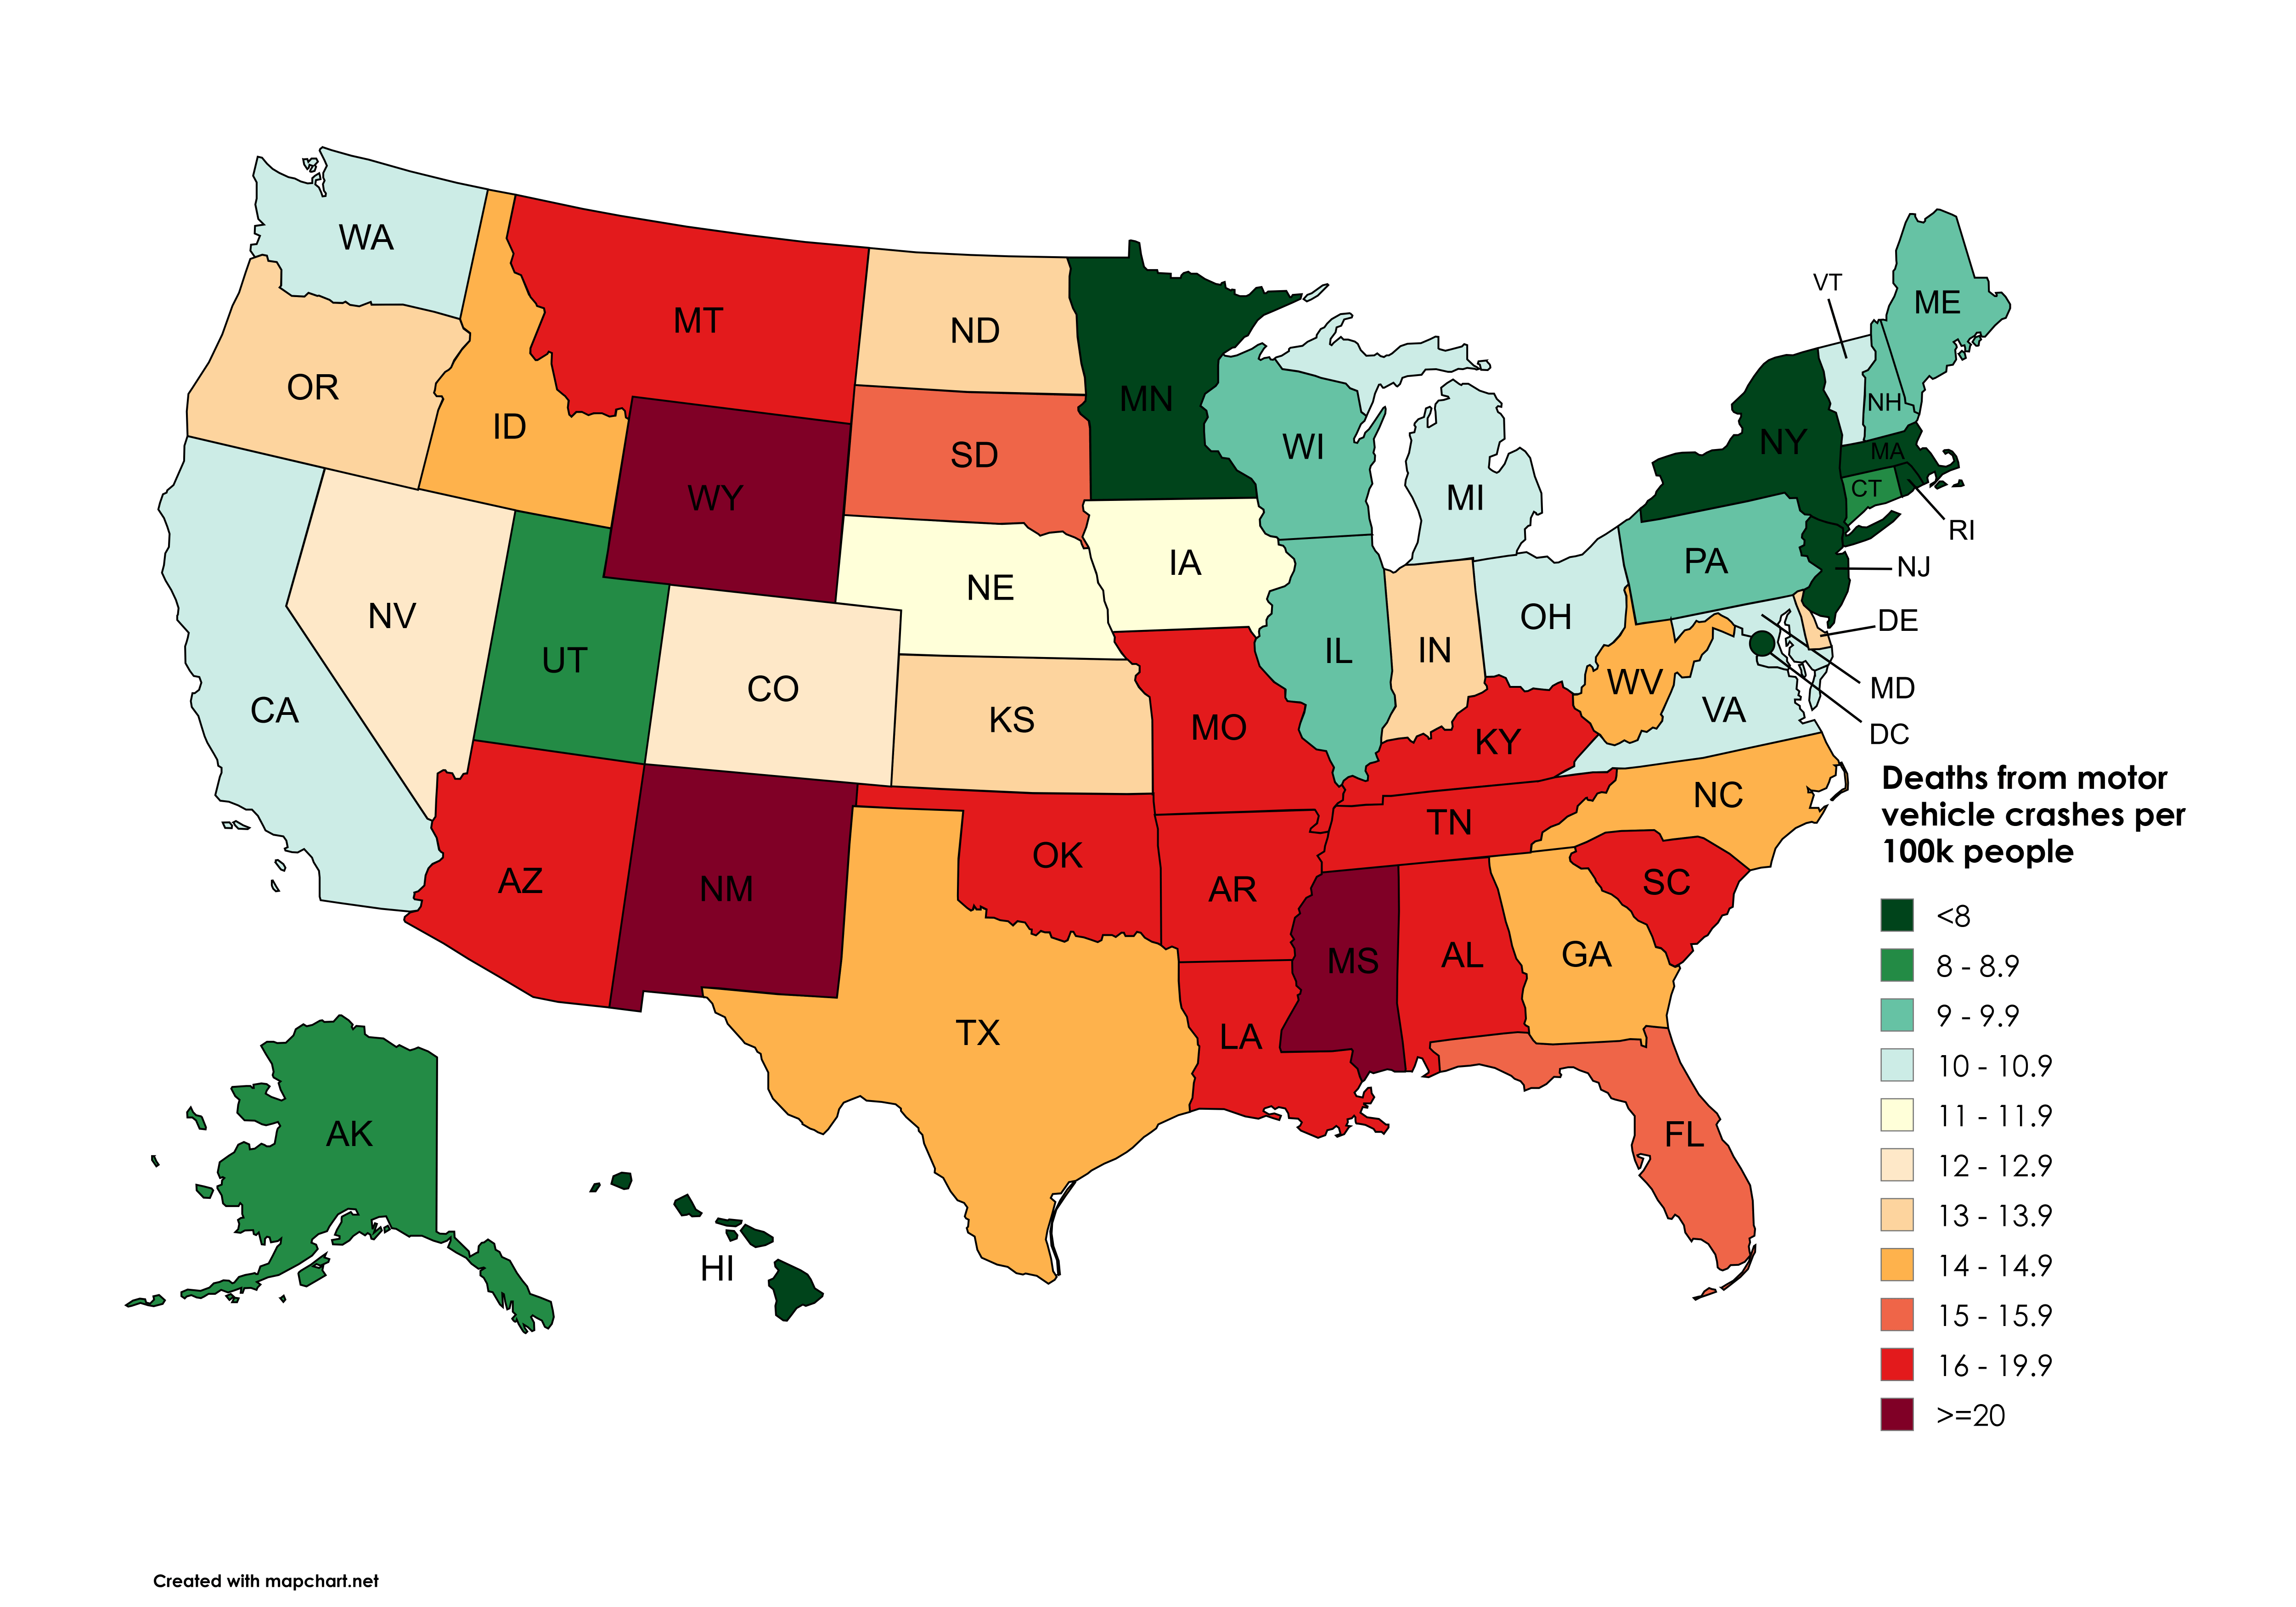
![[OC] Deaths from motor vehicle crashes per 100k people by U.S. state in 2023](https://www.byteseu.com/wp-content/uploads/2025/09/dv8cwik56nnf1-1536x1075.png "[OC] Deaths from motor vehicle crashes per 100k people by U.S. state in 2023")
Data: IIHS (Insurance Institute for Highway Safety): https://www.iihs.org/research-areas/fatality-statistics/detail/state-by-state
Tool: Mapchart.net
Posted by snakkerdudaniel
37 Comments
Why are the red states always the worst? Doesn’t matter what we are looking at, the red states are always really bad.
honestly for how car dense the cities of CA and NY+NJ are, i’m genuinely impressed tbh
edit: i know traffic makes it harder, but people do still speed here, particularly on freeways and late at night
Hey my state’s not first place anymore! Get fucked Wyoming.
Utah. Lmao 😂 where the drivers aren’t hopped up on, well, liquor, drugs or caffeine
Oklahoma making sure everyone remembers that it’s the worst state.
AZ is no shock. I’m a seasoned big city driver and still astounds me that the “traffic” speed around Phoenix is 85+.
Energy, square of velocity, etc.
I’d like to see per mile traveled
Genuinely surprised it is so low in the Northeast, with how fast and aggressive the drivers are there.
I’m colorblind so the extreme ends look the same to me.
I’d love to see this compared to rate of seat belt usage.
I don’t think population density is the sole cause here – MN, WI, MI have to have similar population density as many of those southern states.
I, too, would be very interested to see a separate graph of seatbelt usage.
This graph is kinda useless, it’s deaths per 100k people, so of course in places where lots of people don’t drive at all are going to be lower. Not to mention the fact that city driving is lower speed and less likely to result in deaths.
For a graph like this to be useful it should really be deaths per (100k miles driven).
As someone from St. Louis I’m pretty amazed Maryland isn’t higher. I drove around Baltimore a few months ago and I think those might be the only drivers I’ve ever been afraid of.
As I looked at Mississippi, I wondered whether the fatality rate reflects very poor hospitals. In other words, do they die in the crash itself or do they die within say 24 hours later because of poor doctors and treatment capabilities. As for New Mexico, does it have to do with Reservations?
I simply do not accept the results for Texas. I’ve been to fucking Texas, and I demand a recount or something. Please review, but don’t like go there and review because someone will probably hit you with a car.
Poor color scheme. Should break it down into 5-7 bins and end with the light color as the lowest rate of fatalities.
Mapping deaths normalized by population doesn’t show much. This map will overstate areas where long distance travel is normal. The column that has deaths by miles driven will give a better picture of deadliest drivers
I’m shocked that CO is so low
Wisconsin, where the rampant alcoholism actually makes them better drivers.
After working on ambulances for close to a decade its honestly feels like theres not much sense to who lives or dies in a car accident. Rollover, under back end of a semi? Yup still alive. Hit a stop sign at just the right way, brain bleed and dead.
Does Mississippi just suck ass at everything?
Why are States with ice and snow much better than States without?
For what it’s worth, New Mexico is the state I felt most uncomfortable driving through, so this tracks. Unpredictable and fast, could t wait to leave that state.
Honestly surprised to see the regions with the worst winter weather are still the ones on the low end. Of course, that also means there’s so many potholes that no one can drive faster than 30, anyways.
Would love to see overlaid with corralory data.
Who has mandatory drivers ed, how strict are the drinking or smoking laws, what are the seat belts laws, phone laws, etc. Bet someone like insurance companies already have the models
Would be great to see this compared to other industrialized nations.
The reason that NY/CT/NJ is so low because millions of people in those areas take mass transportation to work and either walk to a station or have a very short drive to one.
Wonder how much of tourists driving around Yellowstone in Wyoming and Montana is a factor for the high numbers.
Why does Mississippi always finish first or last?
Australia: 4.8 in 2023
We drive less AND we have fewer deaths per distance.
The former is due to more people living in the big cities, availability of public transport in those cities and high petrol tax. The latter is possibly due to stricter rules inc a decades-long campaign against drink-driving.
why does the south suck at everything?
What the fuck is this legend?
The lowest and highest are like the same dark color, while the middle range is light?
This data is ugly and nearly unreadable.
The scale isn’t very large. It ranges from 8 to 20+
Can’t believe that NY is the lowest. I drive, ride motorcycle and ride bicycle (hit from behind on a clear no-traffic straightaway) and drivers are flat out dangerous, although PA drivers are way worse. Good lord.
Most of these USA maps are maps of red vs blue states aren’t they?
I swear every data map of the US is the same
Poor Oregon. You can’t even drive over 15 mph, and they still do worse than WA.