Low wages make people move to lower cost of living states.
Nebuli2 on
This map would be a lot more useful if it were net migration per capita.
Dont_Ban_Me_Bros on
It also emphasizes the need to eliminate gerrymandering.
Conscious-Quarter423 on
Democrats, in general, simply must permit more housing to be built in their states. Especially NY, NJ, CO, MA, CA, OR, and WA.
It’s killing them politically and costing them electoral votes and House seats.
StickFigureFan on
All those people moving to Florida that will have to move again when the state is underwater
AbueloOdin on
This is why raw maps have a specific purpose. Like…I’m not sure Nebraska has 4m people to lose. Actually… checks wikipedia… yeah. Nebraska only has 2m. So it lost a solid 10% of it’s population over the course of 30 years? And is light red?
I mean, if you’re trying to figure out where to sell moving truck stuff, this is a good way to picture the size of the market.
Ciarrai_IRL on
Illinois is now a coastal state? Hmm. Cool?
Soggy_Spinach_7503 on
California’s population has increased over 8 million since 1991.
Could this be attributed to boomers retiring and moving south?
thegoatmenace on
its cost of living, its always cost of living.
CharlieParkour on
Back in 1992, I used to say Illinois’ greatest export was its people.
KeyofE on
“Coastal states like… Illinois.” The coast of Lake Michigan?
hankmaka on
Absolutely baffles me that the great lakes region can’t retain people.
chocolatestealth on
I understand that the data here is meant to capture a full decade, but I’d like to see a cutoff of 2019 instead of 2021. We know that remote work caused *a lot* of people to shuffle around in 2020 and 2021, many of whom decided to “undo” their decision in the following years.
emptybagofdicks on
Calling Illinois a coastal state is definitely a choice
ricochet48 on
People like lower taxes, who would have thought.
BrupieD on
This is a strange choice to focus on housing but only include domestic migration not *all* migration.
For instance Minnesota has a net population loss of ~43.82k between 1991 – 2021 but the state’s population increased by ~1.5 *million* during the same time. Census lists MN population as 4,375,099 in 1990 and 5,706,494 in 2020. The birth rate is nowhere near great enough to account for that population increase so it could only be a net *positive* migration rate. Per your chart, Minnesota attracts far more international migration than domestic migration. Don’t those people need housing too?
SpaceManJoe316 on
I wonder at what point does the blue migration start flipping seats?
ContinuedContagion on
Pfft, you can keep Florida and Texas.
SteveBored on
What what what. How can this be? You mean to tell me reddit isnt representative of America and that people actually want to move south?
Well I am shocked
e430doug on
Can we stop including timelines that include the pandemic? It was a meaningless outlier.
dumbledorky on
I don’t see how a map that excludes births and international immigration is in any way useful to showcase the need for housing development. Immigrants and people born after 1991 need housing too…
Reasonable-Meal-7684 on
Huh ?
1991: 18,029,532
2021: 19,848,276
New York’s population grew by over 1.8 million people between 1991 and 2021.
Theveryberrybest on
Hawaii is surprising considering that the ability to move is much harder
perplexedparallax on
I think this is outdated. Covid changed a lot.
Fistbite on
Uh oh, you kicked the hornet’s nest OP by posting a map on Reddit that makes blue states look bad
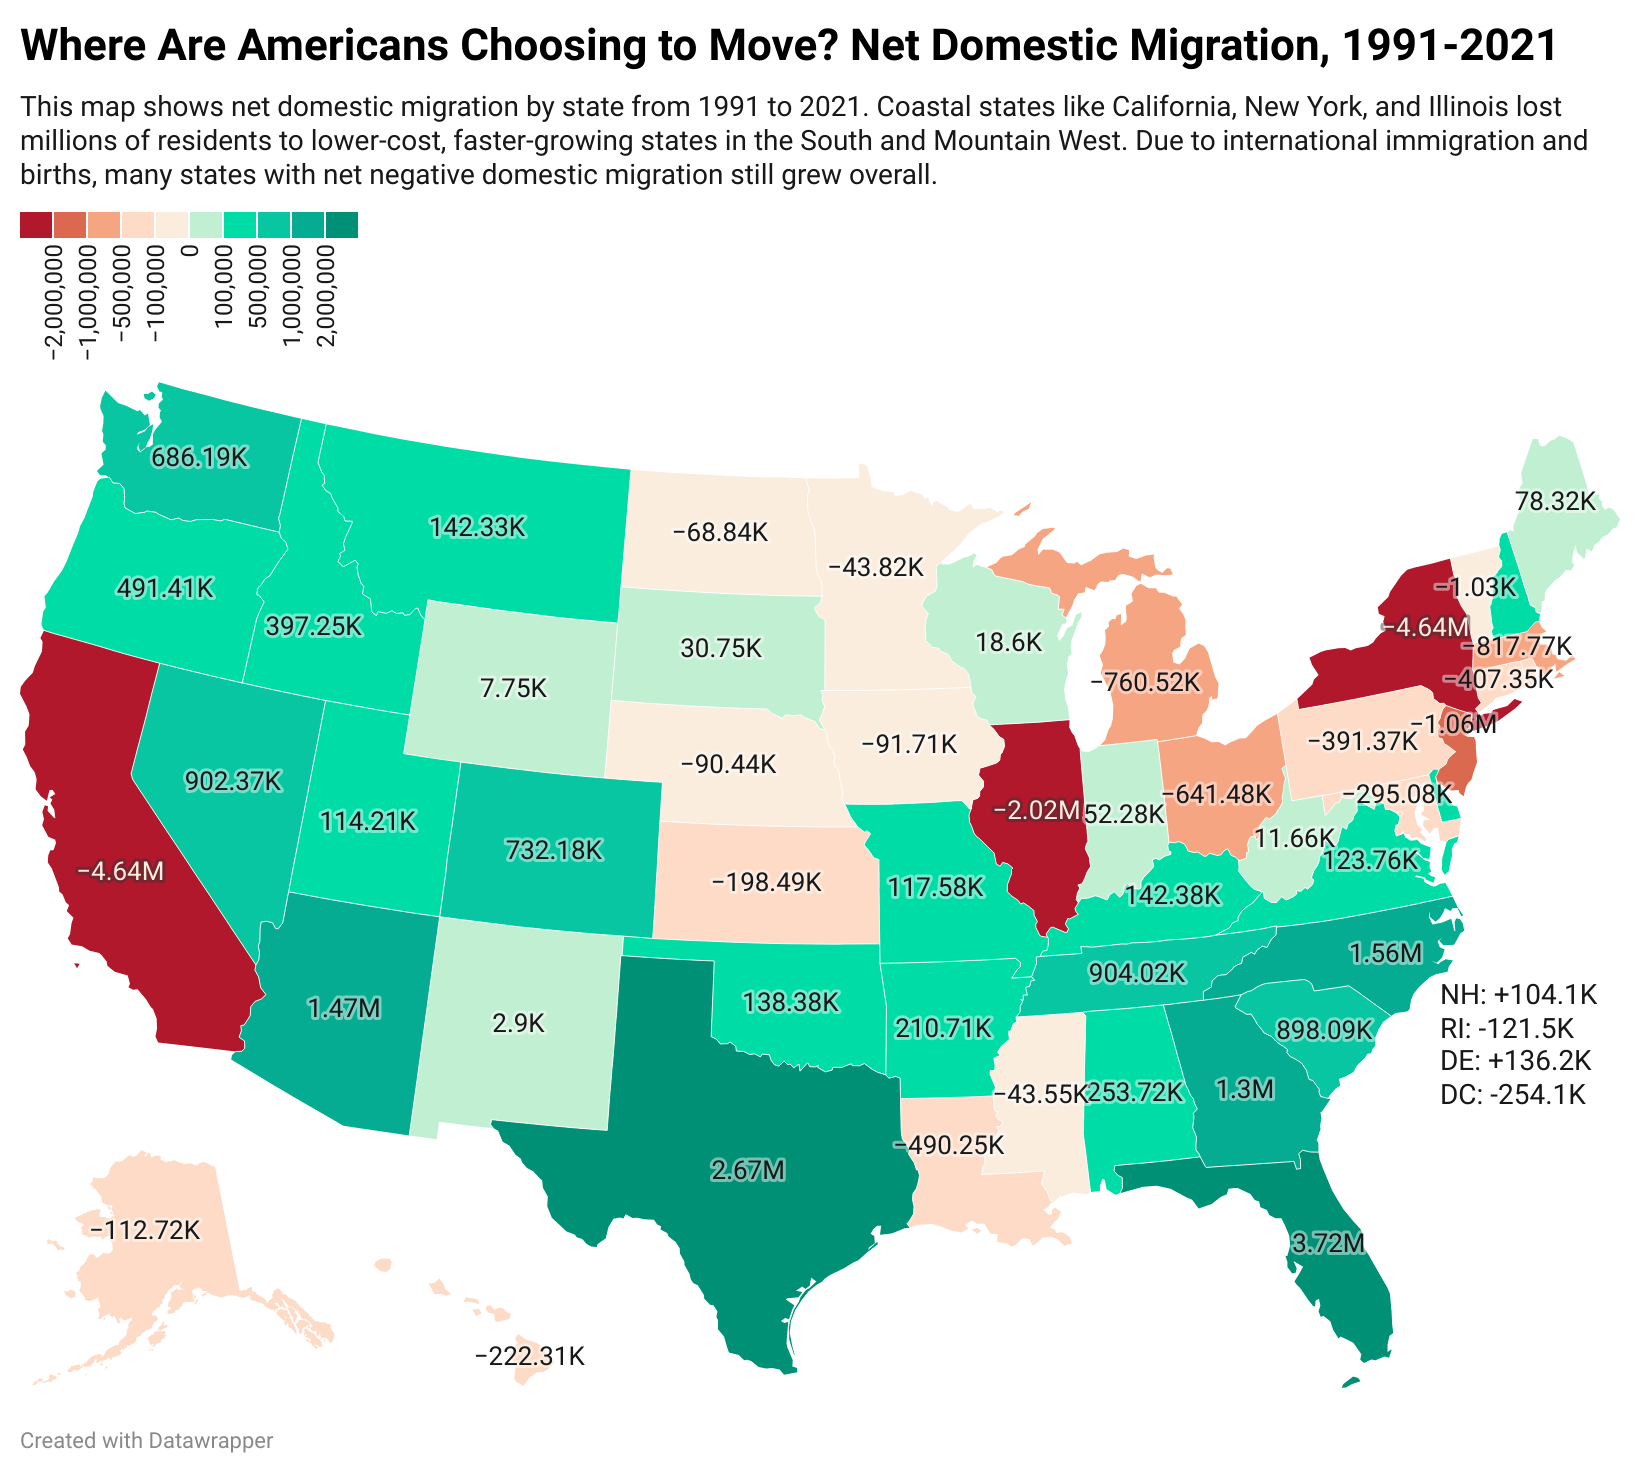

![[OC] Where Americans Are Moving (And Why Democrats Must Build Housing)](https://www.byteseu.com/wp-content/uploads/2025/09/0582g3jad1of1-1536x1381.png "[OC] Where Americans Are Moving (And Why Democrats Must Build Housing)")
27 Comments
Low wages make people move to lower cost of living states.
This map would be a lot more useful if it were net migration per capita.
It also emphasizes the need to eliminate gerrymandering.
Democrats, in general, simply must permit more housing to be built in their states. Especially NY, NJ, CO, MA, CA, OR, and WA.
It’s killing them politically and costing them electoral votes and House seats.
All those people moving to Florida that will have to move again when the state is underwater
This is why raw maps have a specific purpose. Like…I’m not sure Nebraska has 4m people to lose. Actually… checks wikipedia… yeah. Nebraska only has 2m. So it lost a solid 10% of it’s population over the course of 30 years? And is light red?
I mean, if you’re trying to figure out where to sell moving truck stuff, this is a good way to picture the size of the market.
Illinois is now a coastal state? Hmm. Cool?
California’s population has increased over 8 million since 1991.
But we absolutely must build more housing.
[https://fred.stlouisfed.org/series/CAPOP](https://fred.stlouisfed.org/series/CAPOP)
Could this be attributed to boomers retiring and moving south?
its cost of living, its always cost of living.
Back in 1992, I used to say Illinois’ greatest export was its people.
“Coastal states like… Illinois.” The coast of Lake Michigan?
Absolutely baffles me that the great lakes region can’t retain people.
I understand that the data here is meant to capture a full decade, but I’d like to see a cutoff of 2019 instead of 2021. We know that remote work caused *a lot* of people to shuffle around in 2020 and 2021, many of whom decided to “undo” their decision in the following years.
Calling Illinois a coastal state is definitely a choice
People like lower taxes, who would have thought.
This is a strange choice to focus on housing but only include domestic migration not *all* migration.
For instance Minnesota has a net population loss of ~43.82k between 1991 – 2021 but the state’s population increased by ~1.5 *million* during the same time. Census lists MN population as 4,375,099 in 1990 and 5,706,494 in 2020. The birth rate is nowhere near great enough to account for that population increase so it could only be a net *positive* migration rate. Per your chart, Minnesota attracts far more international migration than domestic migration. Don’t those people need housing too?
I wonder at what point does the blue migration start flipping seats?
Pfft, you can keep Florida and Texas.
What what what. How can this be? You mean to tell me reddit isnt representative of America and that people actually want to move south?
Well I am shocked
Can we stop including timelines that include the pandemic? It was a meaningless outlier.
I don’t see how a map that excludes births and international immigration is in any way useful to showcase the need for housing development. Immigrants and people born after 1991 need housing too…
Huh ?
1991: 18,029,532
2021: 19,848,276
New York’s population grew by over 1.8 million people between 1991 and 2021.
Hawaii is surprising considering that the ability to move is much harder
I think this is outdated. Covid changed a lot.
Uh oh, you kicked the hornet’s nest OP by posting a map on Reddit that makes blue states look bad
Illinois is coastal state?