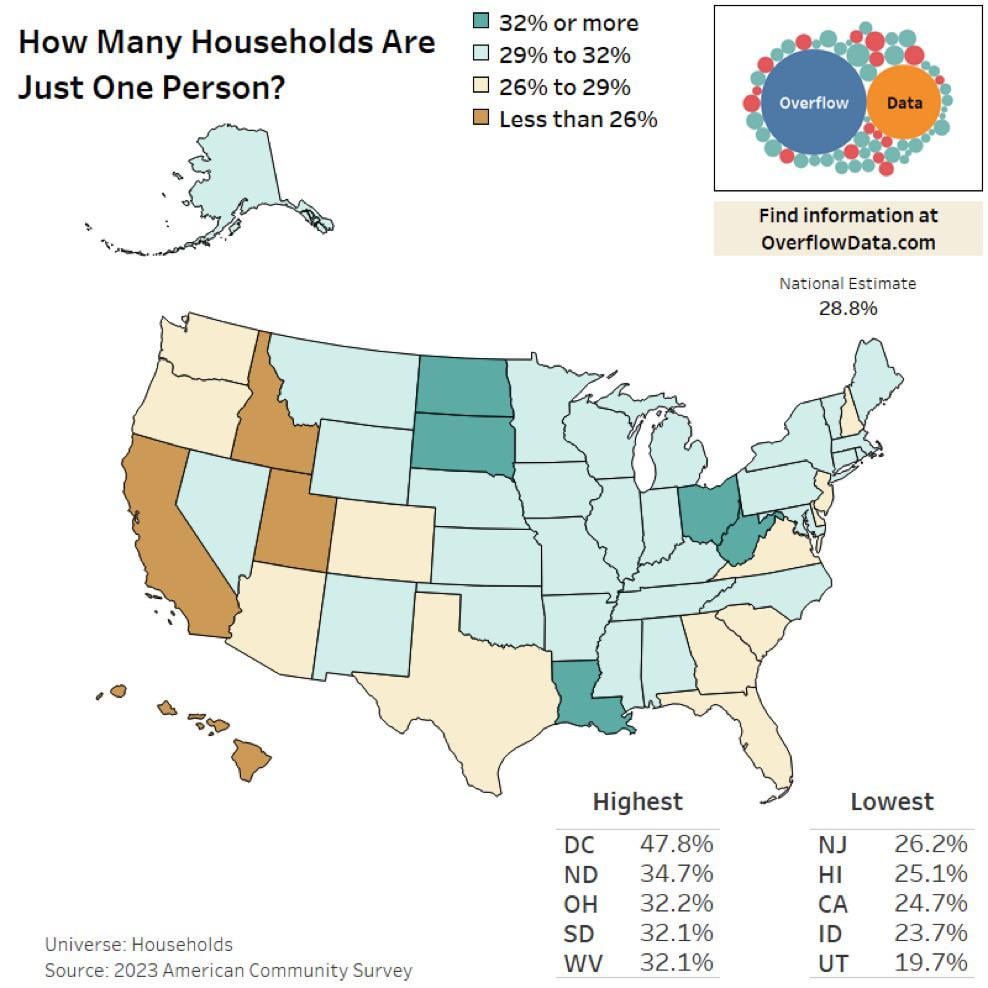
This data viz shows what percentage of households are occupied by 1 person. The visualization was created in Tableau and the data comes from the 2023 American Community Survey.
Let me know if you think there are things I should add.
Wafflinson on
The three lowest make sense. Utah and Idaho have Mormons and big families, and no one in California can afford a place to live by themselves.
shidekigonomo on
Hawaii makes sense. Whenever someone tells me they’re moving alone to Hawaii to live the dream, in my head I know they’ll be back in a year. Yes, culturally there’s still a lot of multigenerational households, but in the end, the cost of living is too high and the wages too low to make it as a one-income household for most people.
[deleted] on
[deleted]
marmosetohmarmoset on
Finally a map that’s not just wealth or cities.
Bill_Nihilist on
Putting New Jersey at the top of the lowest is a little confusing because that will make readers think that it is the lowest not the fifth most lowest
Brighter_rocks on
what’s kinda striking is that dc has almost half of households as just one person, while places like california and hawaii, where you’d expect lots of singles, are actually at the bottom. looks like the insane housing costs in ca/hi/nj push people into sharing, but dc is this weird outlier because it’s packed with young, transient professionals who can afford or are willing to live alone for career reasons. and then on the other end you see north dakota, south dakota, west virginia showing up high too, which is probably not about young singles at all but older folks aging in place. so you’ve got this split story: urban dc with ambitious solo renters, and rural states with older populations living alone, while the supposedly “single-friendly” coastal expensive states are actually the most crowded

7 Comments
This data viz shows what percentage of households are occupied by 1 person. The visualization was created in Tableau and the data comes from the 2023 American Community Survey.
You can find an interactive version of this information in the [State Data Explorer](https://overflowdata.com/state-data/) I have created.
Let me know if you think there are things I should add.
The three lowest make sense. Utah and Idaho have Mormons and big families, and no one in California can afford a place to live by themselves.
Hawaii makes sense. Whenever someone tells me they’re moving alone to Hawaii to live the dream, in my head I know they’ll be back in a year. Yes, culturally there’s still a lot of multigenerational households, but in the end, the cost of living is too high and the wages too low to make it as a one-income household for most people.
[deleted]
Finally a map that’s not just wealth or cities.
Putting New Jersey at the top of the lowest is a little confusing because that will make readers think that it is the lowest not the fifth most lowest
what’s kinda striking is that dc has almost half of households as just one person, while places like california and hawaii, where you’d expect lots of singles, are actually at the bottom. looks like the insane housing costs in ca/hi/nj push people into sharing, but dc is this weird outlier because it’s packed with young, transient professionals who can afford or are willing to live alone for career reasons. and then on the other end you see north dakota, south dakota, west virginia showing up high too, which is probably not about young singles at all but older folks aging in place. so you’ve got this split story: urban dc with ambitious solo renters, and rural states with older populations living alone, while the supposedly “single-friendly” coastal expensive states are actually the most crowded