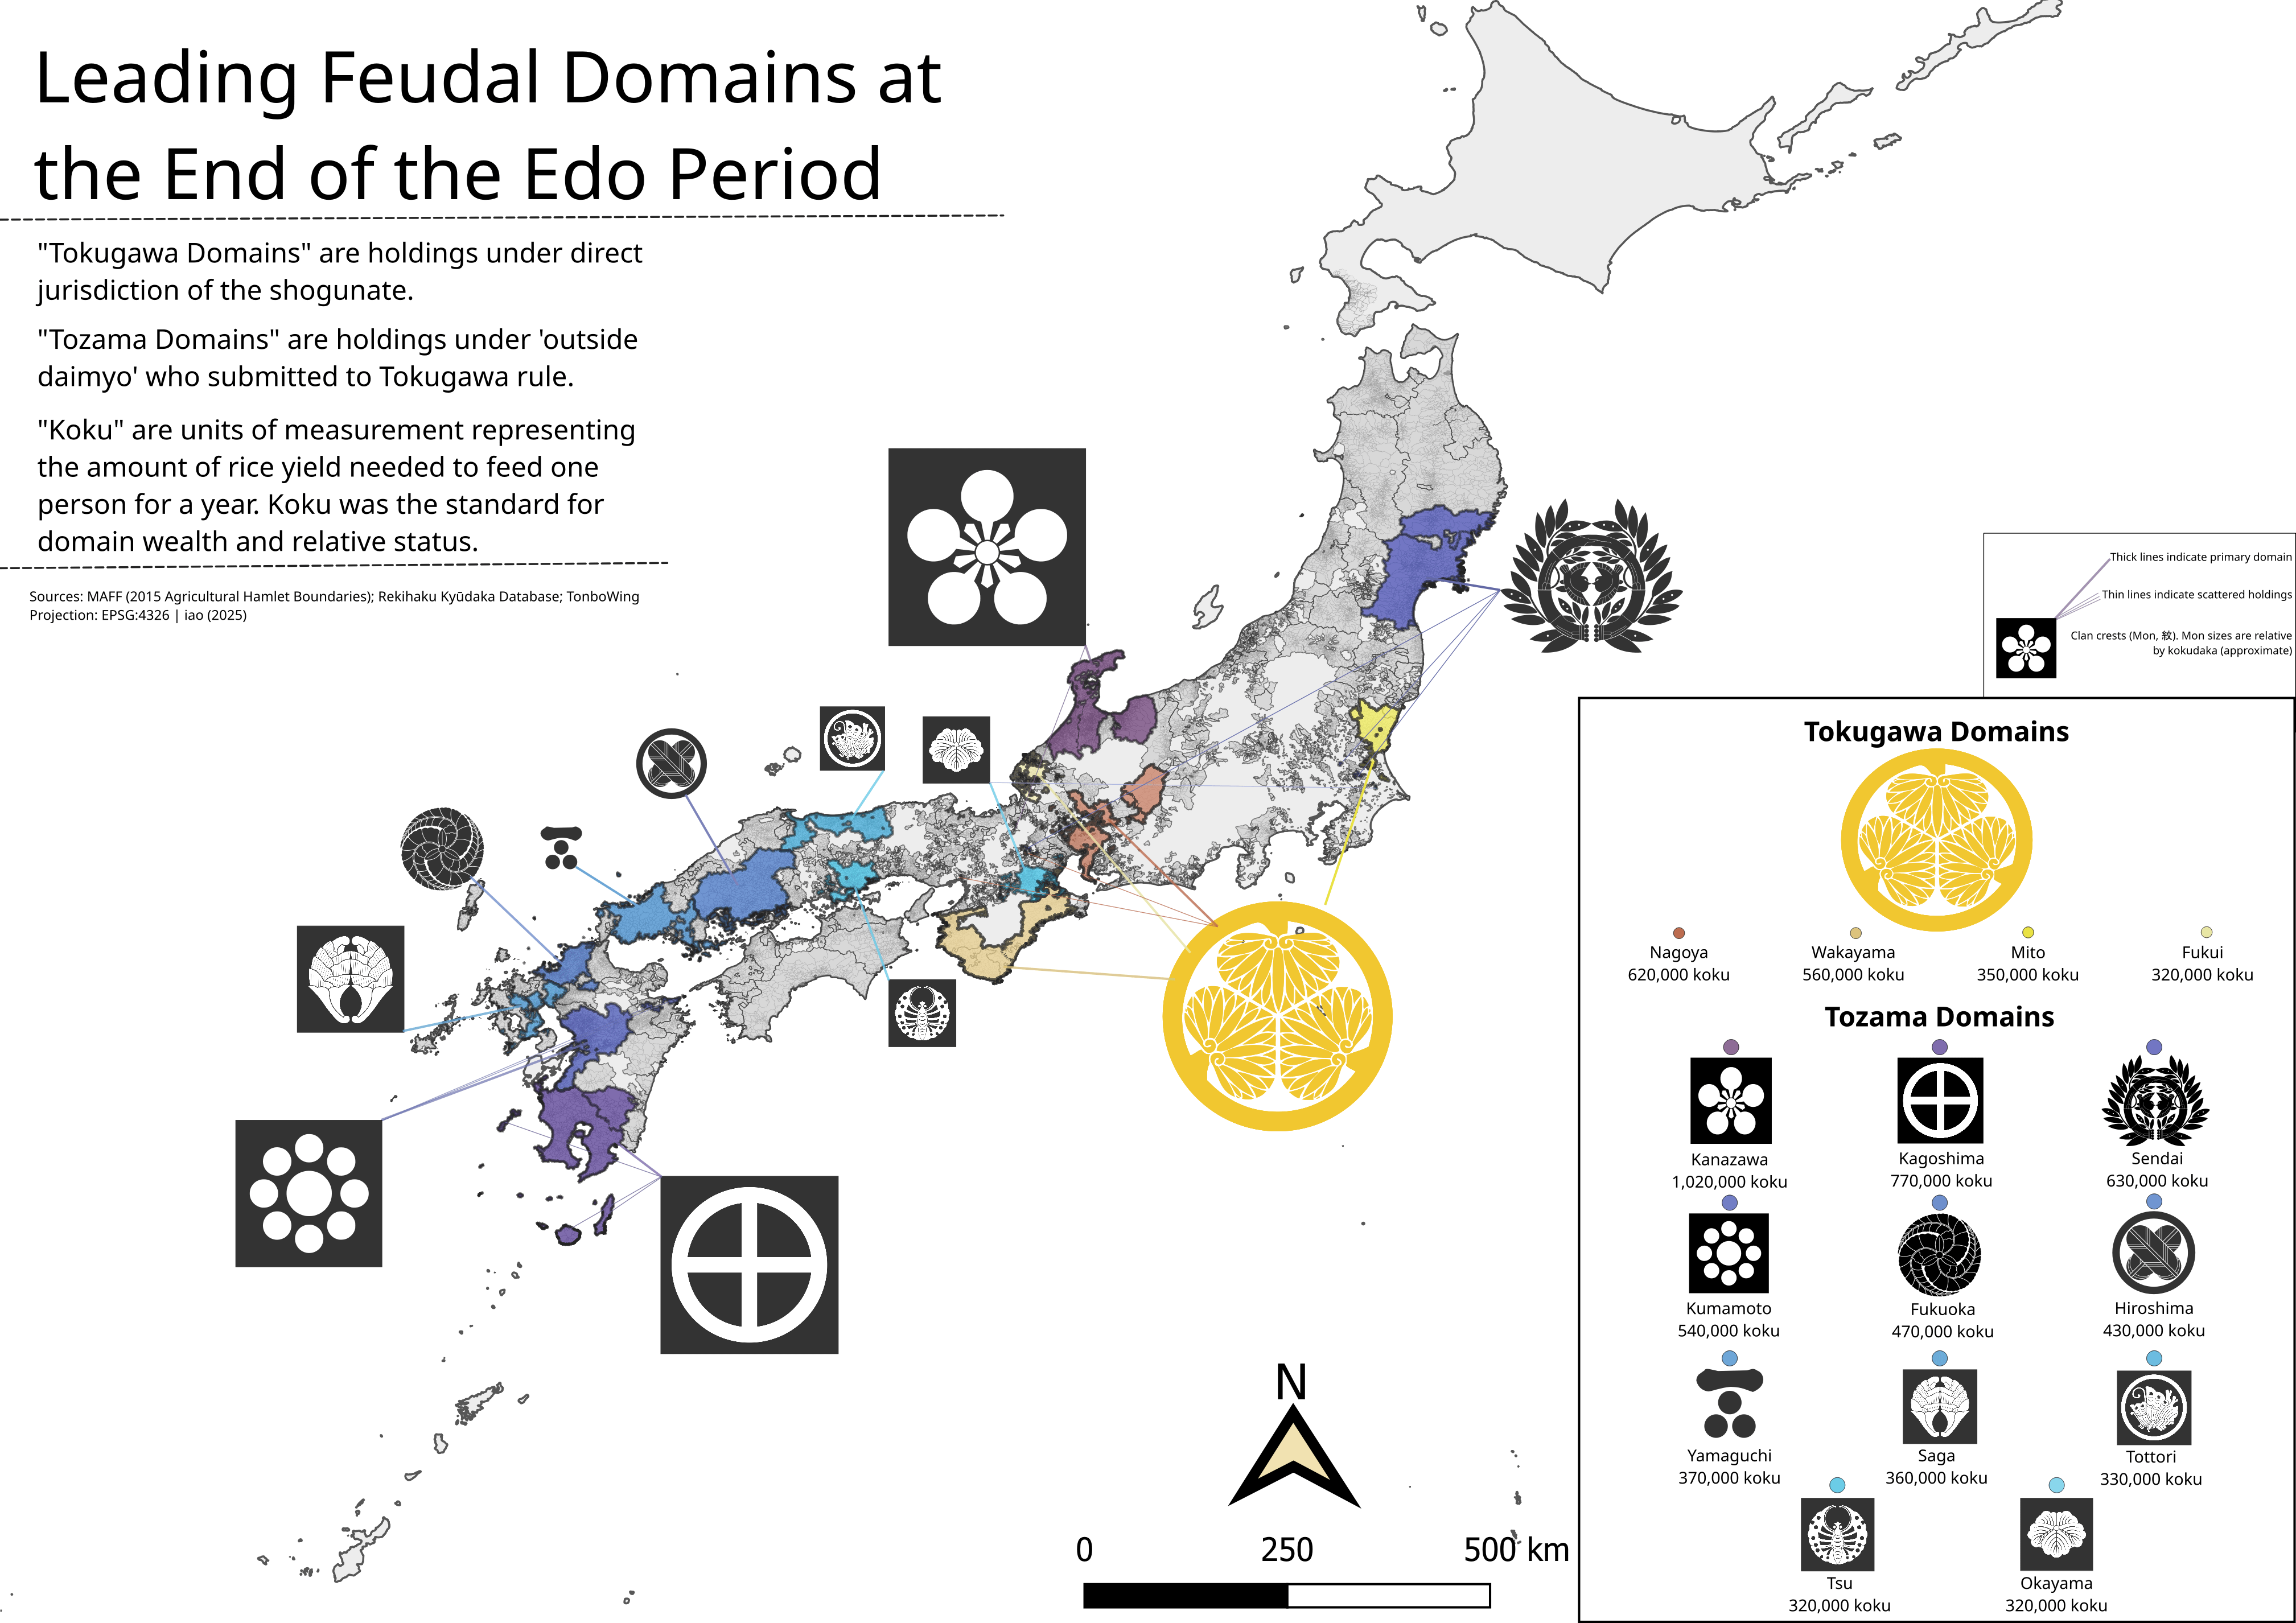
Edo Period Domains controlled by Daimyo had relative wealth, status, and power measured by annual rice yield, or kokudaka. This map exhibits the 15 leading domains by the end of the Edo period. ~18862, Japan [OC]
This map graphic was created by me using QGIS. The data was curated by me by using early Meiji village locations associated with clans/domains (from the Japanese museum rekihaku) and utilizing agricultural settlement boundaries that have a correspondence with the villages (MAFF) as the geospatial proxy. I’ve also used domain kokudaka values provided by Tonbiwing.
erksplat on
I’m curious if Reddit will still be relevant in 18862.
314per on
Very cool map.
In your labels, it looks like you’ve got the Okayama mon listed as Tsu and vice versa.

![Edo Period Domains controlled by Daimyo had relative wealth, status, and power measured by annual rice yield, or kokudaka. This map exhibits the 15 leading domains by the end of the Edo period. ~18862, Japan [OC]](https://www.byteseu.com/wp-content/uploads/2025/09/fsfhlhodgfof1-1536x1086.png "Edo Period Domains controlled by Daimyo had relative wealth, status, and power measured by annual rice yield, or kokudaka. This map exhibits the 15 leading domains by the end of the Edo period. ~18862, Japan [OC]")
3 Comments
This map graphic was created by me using QGIS. The data was curated by me by using early Meiji village locations associated with clans/domains (from the Japanese museum rekihaku) and utilizing agricultural settlement boundaries that have a correspondence with the villages (MAFF) as the geospatial proxy. I’ve also used domain kokudaka values provided by Tonbiwing.
I’m curious if Reddit will still be relevant in 18862.
Very cool map.
In your labels, it looks like you’ve got the Okayama mon listed as Tsu and vice versa.