
![[OC] US Immigration Court Rulings, by Outcome (2025-2025)](https://www.byteseu.com/wp-content/uploads/2025/09/qxbcm8u4wiof1-1536x918.png "[OC] US Immigration Court Rulings, by Outcome (2025-2025)")
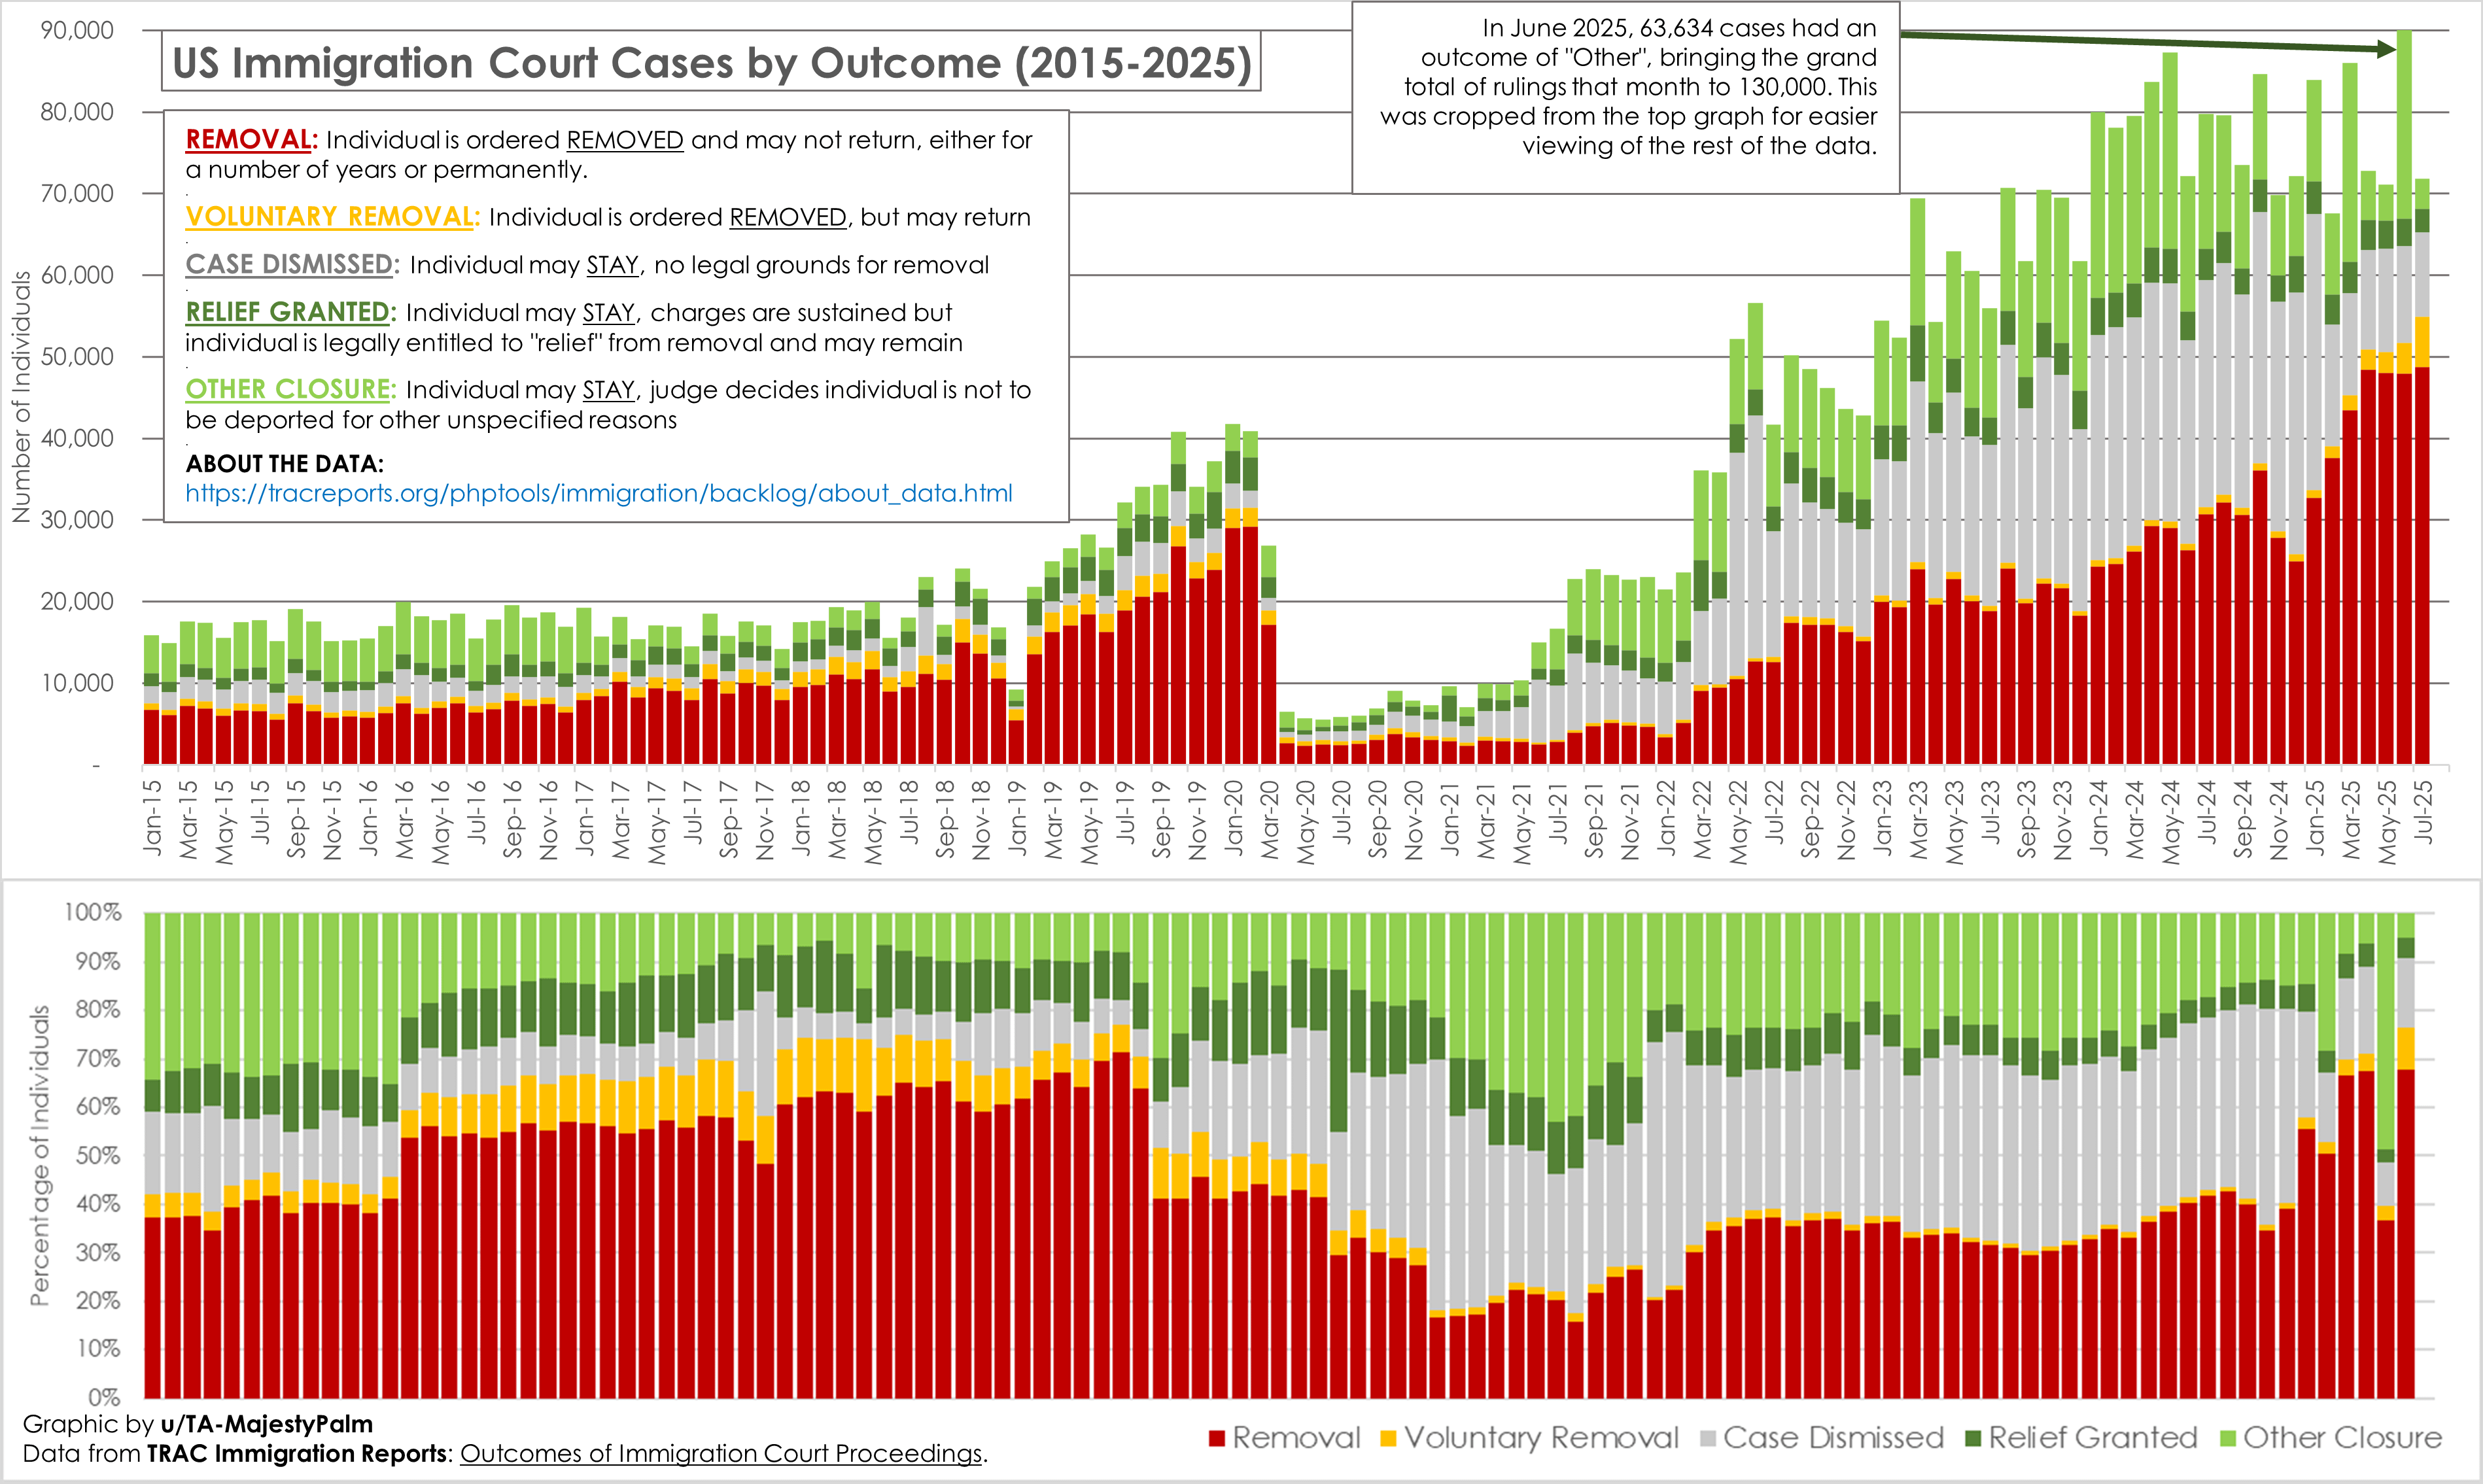
Graphic by me, showing immigration court rulings by individual case and outcome (top graph) and by percentage of outcome (bottom graph).
Source here, which includes more datasets and longer definitions of each ruling/outcome: https://tracreports.org/phptools/immigration/closure/
I chose to show the last 10 years, which includes both Trump Administrations, Biden Administration, and the end of the Obama Administration for reference.
Posted by TA-MajestyPalm
14 Comments
Graphic by me, showing immigration court rulings by individual case and outcome (top graph) and by percentage of outcome (bottom graph).
Source here, which includes more datasets and longer definitions of each ruling/outcome: https://tracreports.org/phptools/immigration/closure/
I chose to show the last 10 years, which includes both Trump Administrations, Biden Administration, and the end of the Obama Administration for reference.
During this entire time period, immigration court has had a [massive backlog](https://tracreports.org/phptools/immigration/backlog/)
HELP: I am curious if anyone knows what happened in June 2025 – about 60,000 cases were allowed to stay for “other” reasons. I am thinking it was some supreme Court ruling which freed up many pending cases, but I haven’t been able to figure it out.
Crazy how the number of cases exploded in the last decade – outcomes moved around a bit, but removal still rules the chart
Is it just me, or does it actually seem that court rulings tend to side with the ruling political party?
Probably not something many would have expected, but removal cases (and volume of cases) under Biden outstripped much of Trump’s first administration. I guess maybe they were enforcing the laws more than some would have liked us to believe.
Dang, what happened in 2020?
Very interesting data. Thanks for putting it together. To gain personal insight, I sat in on a few immigration hearings. The judges seemed fair and empathetic, often granting extensions if individuals don’t have their paperwork in order. To the comment that the outcomes seem tied to political sentiment. I learned that even if the judge ruled for an extension, the government lawyer can object and have the individual (or family) detained and scheduled for an expedited hearing. Typically, those individuals are deported within 30 days. We could tell if the government was going to move for an expedited hearing as ICE would be waiting in the hallway to detain the individual.
This is very interesting and nicely presented. It might be a little misleading in that it doesn’t give a picture of the total number of crossings/people seeking asylum. It seems like (without looking up the numbers) crossings were somewhere around 30k/month in the early part of the chart but up to 300k/month at other points. Another set of bars that shows monthly crossings would add some useful context.
Otherwise, well done.
Would be best to also further indicate the administration, but overall you make a hell of a visual!
Given the volatility associated with COVID, the second chart seems to provide better contrast across the administrations (IMO). The one curious change to me is there is a very clear surge of “dismissals” around and after COVID, which kinda aligns with the beginning of the Biden admin. Anyone have thoughts on what changed? Theories:
– a court precedent that altered how judges view things
– an immigration law change
– an effort to increase enforcement that failed more often
– COVID itself became a reason not to remove someone
Here’s a fun headline you could write from this: “Trump immigration courts allow more immigrants to stay in the US than Obama ever did.”
This is really interesting data. I’ve been saying for decades that the roots of the immigration “crisis” are in our failure to fund enough immigration courts to keep the backlog down. So seeing the courts processing far more cases — even under the Trump administration — and letting people in — even under the Trump administration — is heartening.
Do you have data on backlog? How many cases are currently open and unresolved?
Fascinating plot, thanks! It looks like the bottom graph may be misaligned–using the date markers from the top figure, it looks like there was a proportional drop in removals in Sept 2019, but looking at the actual data I assume that is actually supposed to be March 2020 with the start of the pandemic.
This is freaking awesome, nice work!
I don’t think these charts line up… There seems to be an error somewhere. The bottom chart looks like it might be 7 months earlier than the top chart…
Interesting. I wonder what the usual causes for someone to get a “case dismissed” or “other closure” ruling are since they’ve become to much more prevalent after COVID