
![[OC] Number of artists as a percentage of total labour force, 2023](https://www.byteseu.com/wp-content/uploads/2025/09/1hr25n2jecsf1-1536x1075.png "[OC] Number of artists as a percentage of total labour force, 2023")
Hi! I am new to the community and would love to know more and learn from the folks here!
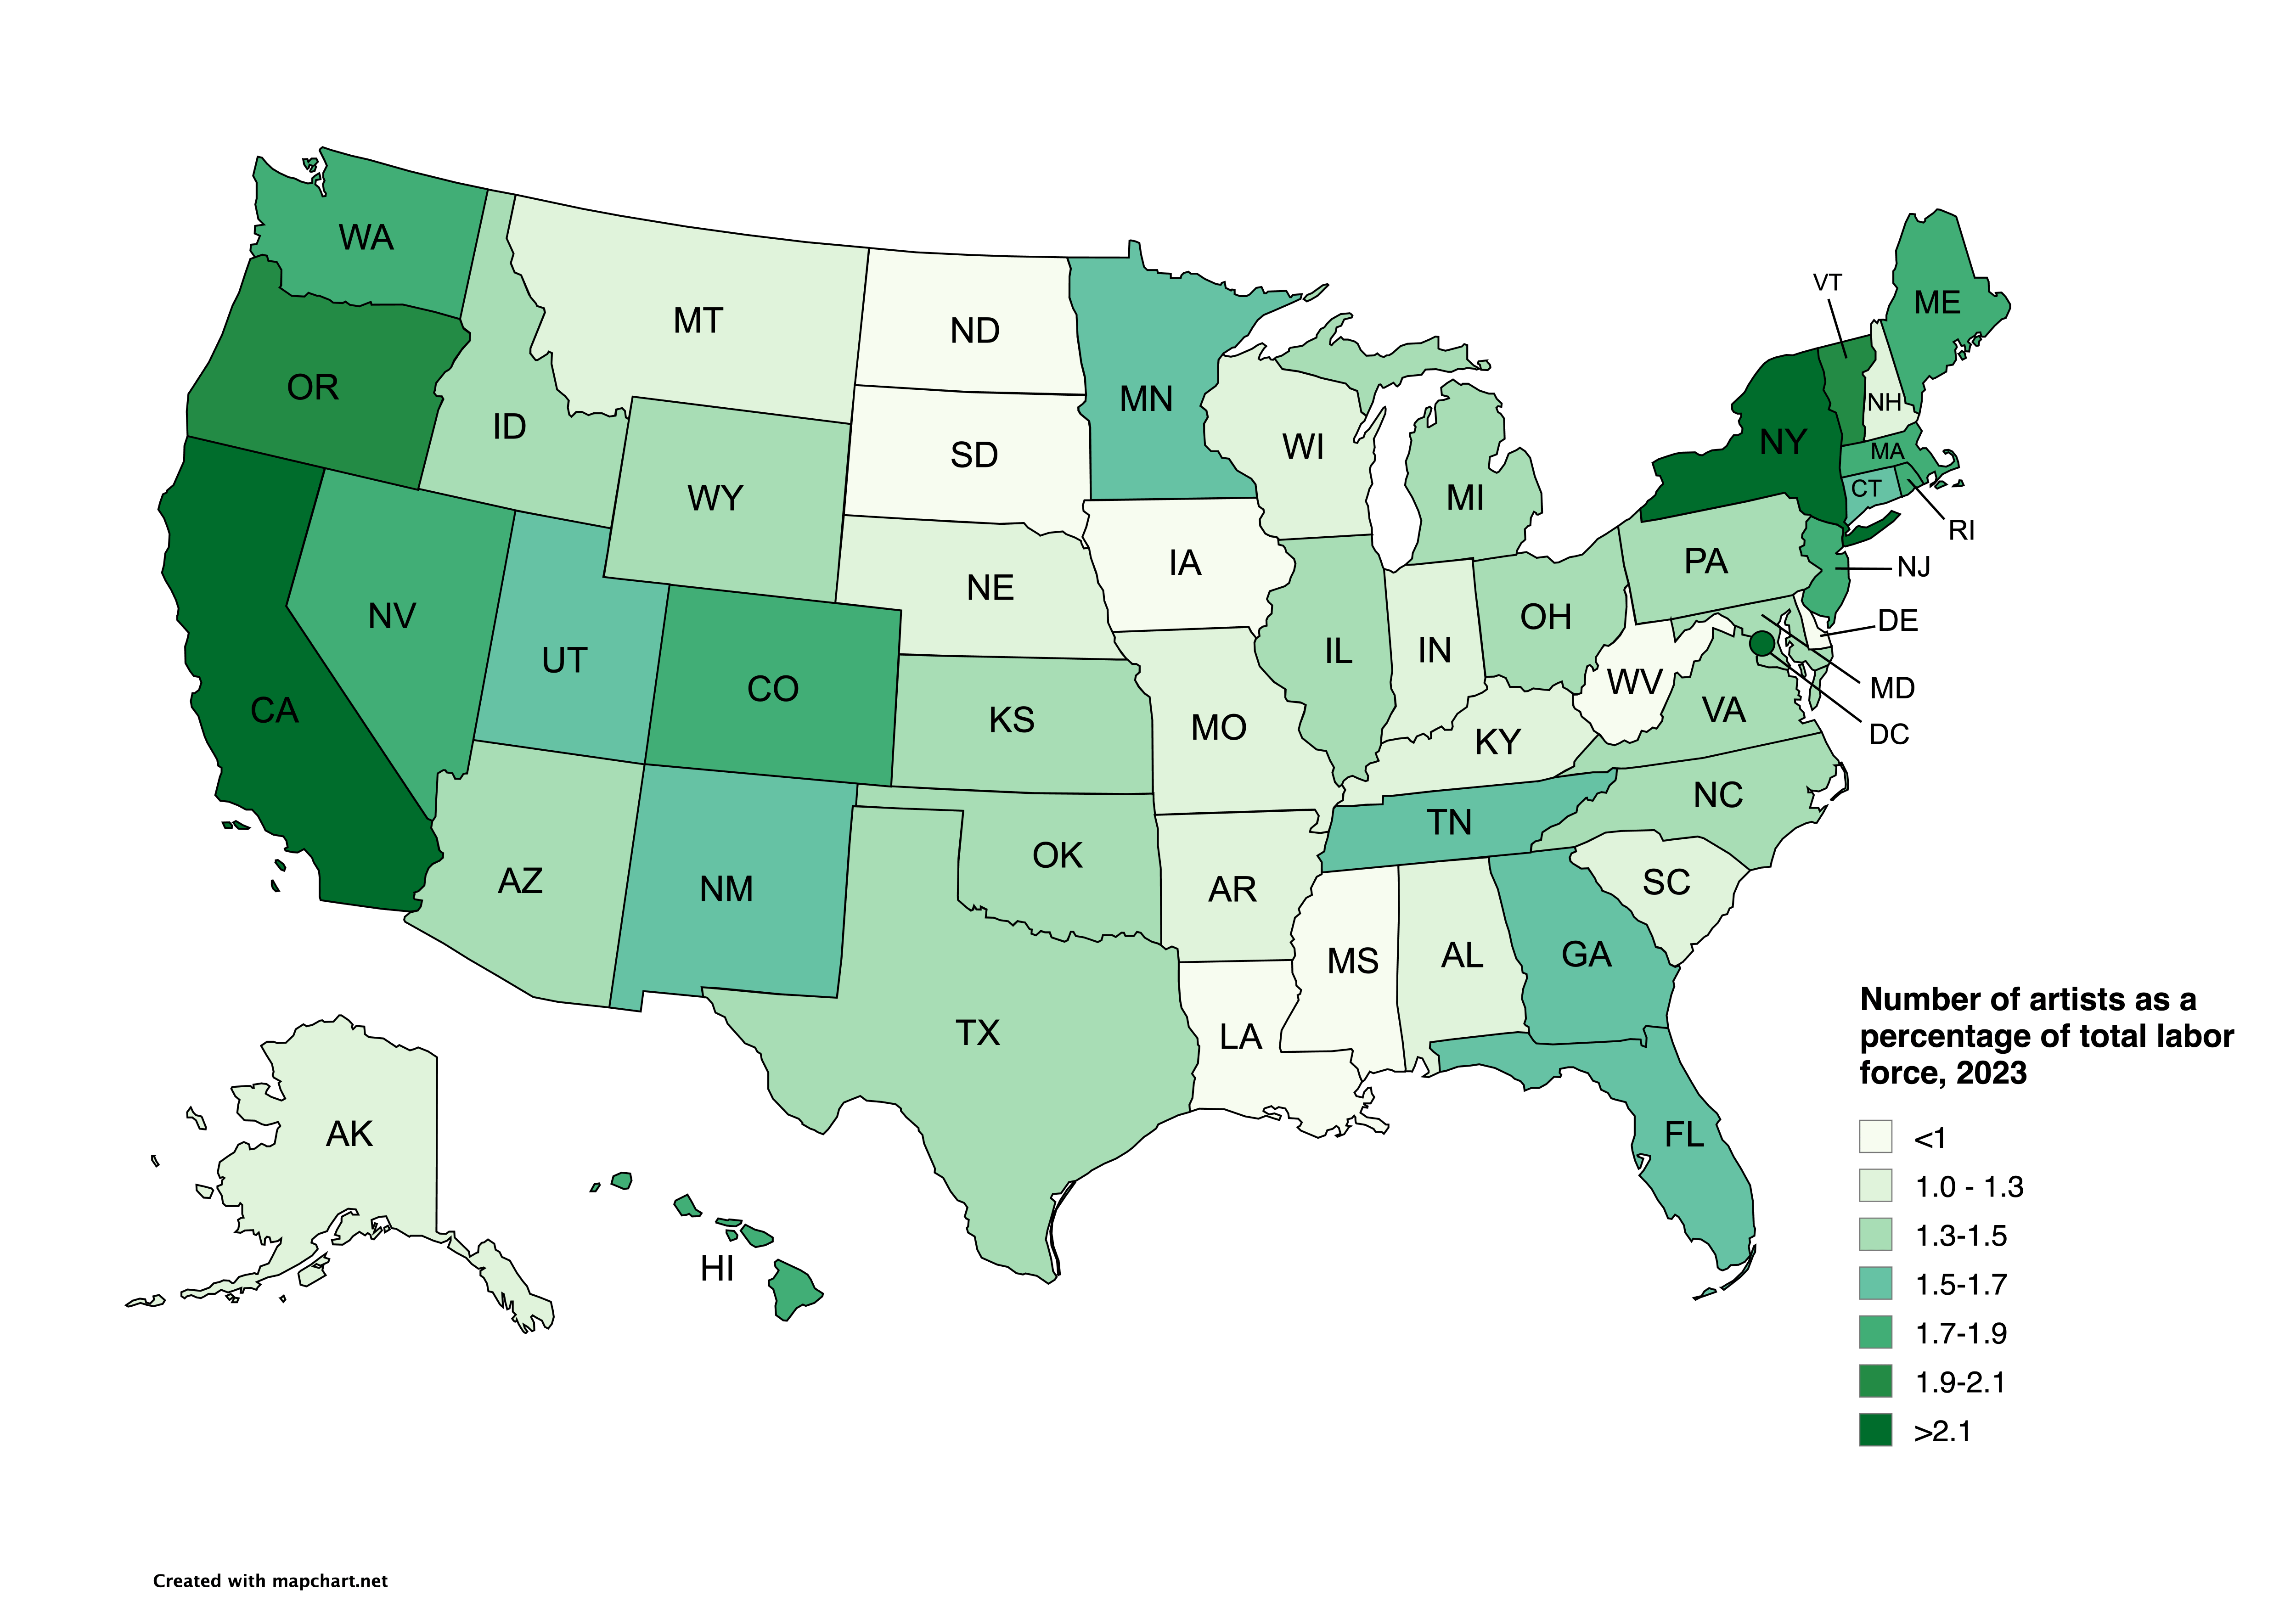
Data Source: National Endowment for the arts https://www.arts.gov/impact/research/NASERC/artists-and-other-cultural-workers
Tool: https://www.mapchart.net/
Posted by vanodrama
12 Comments
Huh, I’m surprised Louisiana is so low.
What does TX look like without Austin?
I wonder how long it’s going to take before people start questioning the data sources here on Which State is Best?
The binning is a little weird imho, because more than 2.1% can mean a lot of things.
Artist businesses get a small tax break in some jurisdictions fwiw. The “fun” part is when they grow to something more commercial = you lost the tax break, you regained the tax break, you lost .. etc, etc..
Need more producers. Not artists.
a good answer for when people ask what’s the difference between Vermont and New Hampshire
This has some, though not perfect, correlation to the homeless map I posted some time ago.
I’m surprised New Mexico isn’t higher.
For those wondering, according to the source, the following fields are the definition of “artists”:
* Designers
* Fine artists (incl. art directors and animators)
* Architects (incl. landscape architects)
* Writers (incl. authors)
* Producers (incl. directors)
* Musicians (incl. composers and music directors)
* Photographers
* Announcers
* Actors
* Entertainers
* Dancers (incl. choreographers)
Basically a “where are the orchards” map
So, the darker the green the higher the percentage of free loaders who get paid for finger painting, right?