So much potential here. Maybe aplit x axis into bins?
tyedge on
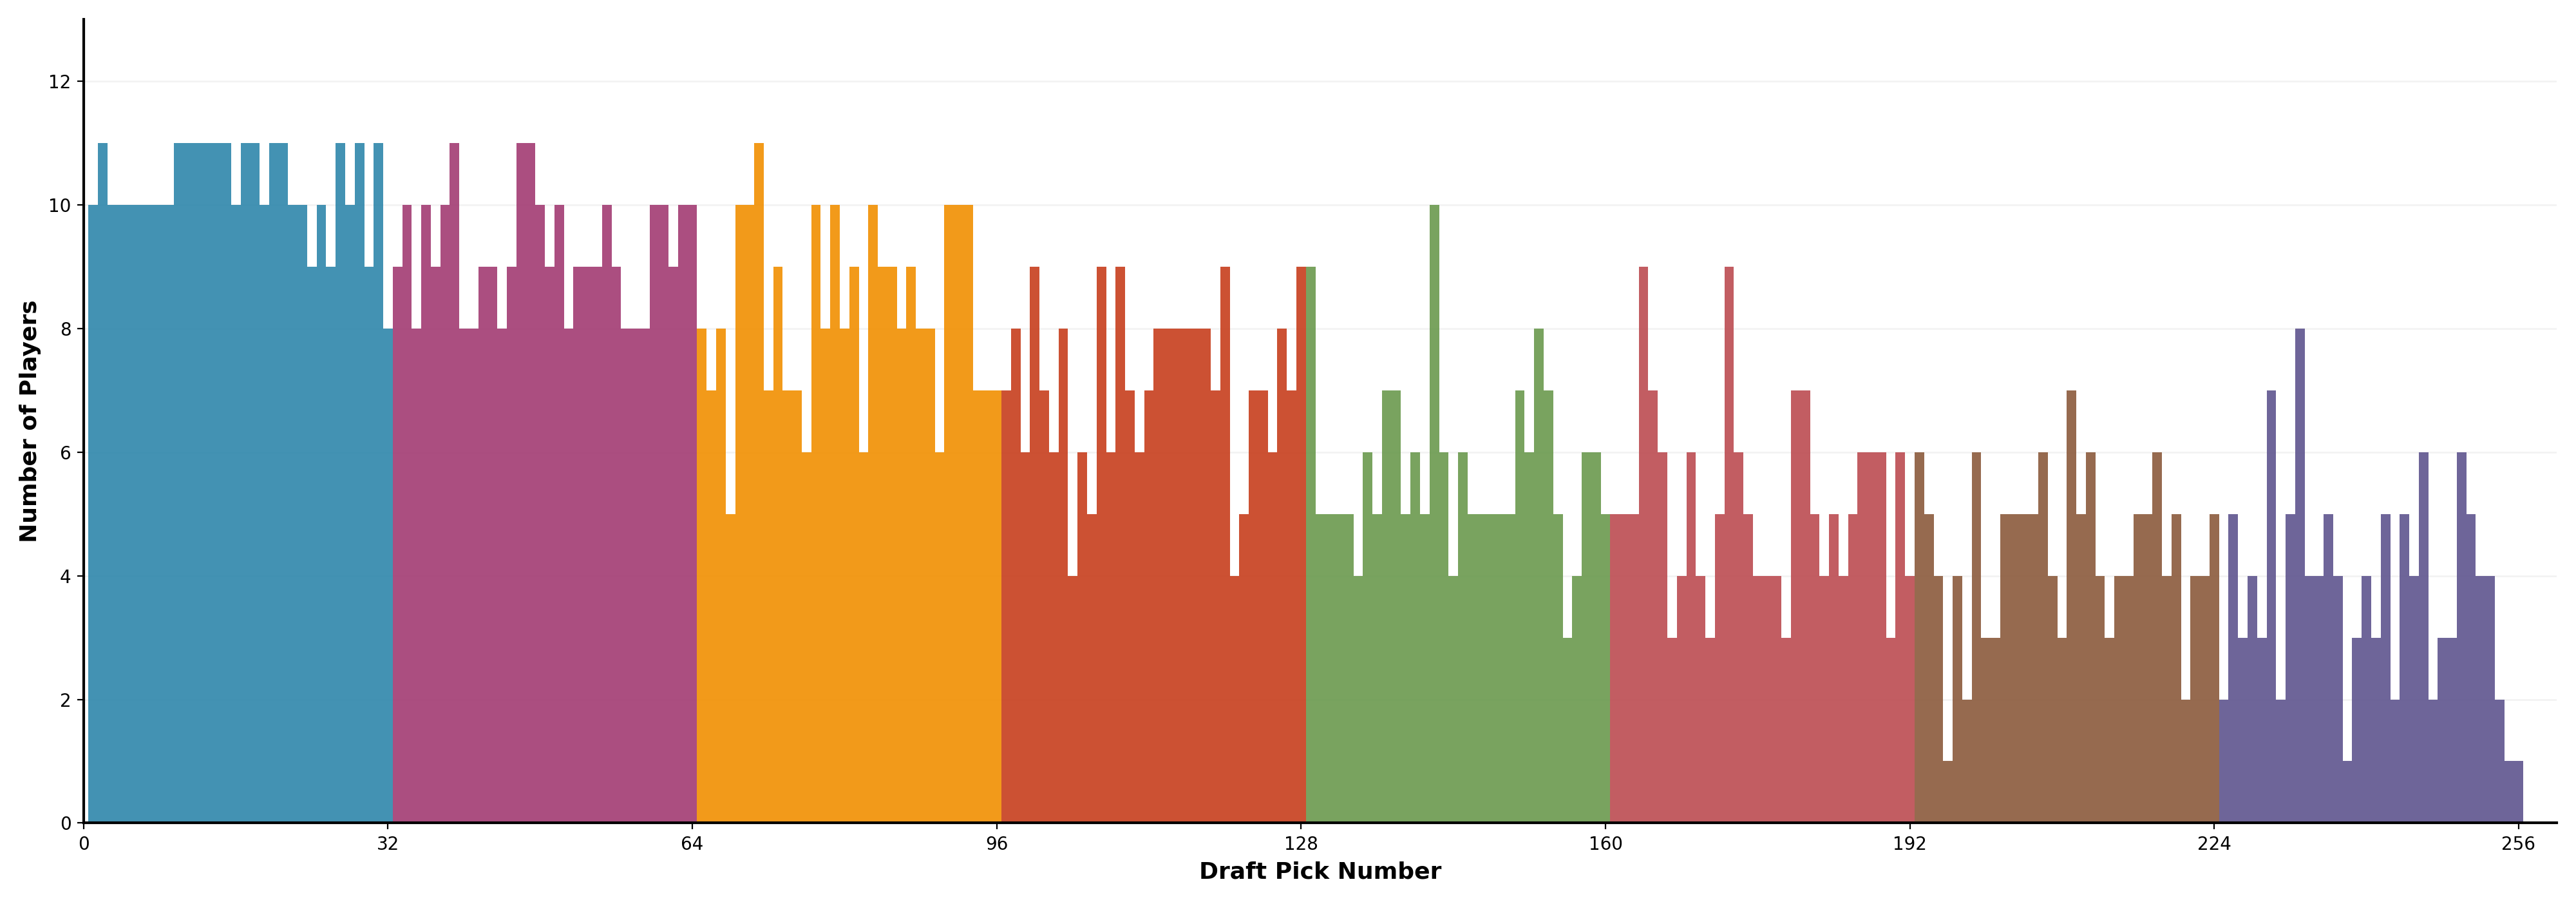
2006-2019 is 14 drafts. 11 appears to be the high mark on the graph. So at least 3 of every pick didn’t even survive their rookie deal? That seems wrong.
chrissamperi on
Tom Brady very clearly is not on this chart. 😂
majwilsonlion on
~~Wow, only 25% of even the 1st round picks make it past 4 years.~~
Chad_Broski_2 on
I’m looking at some of the data and I’m not sure I agree. Only 10 first overall picks made it 4 years? I just looked [here](https://en.m.wikipedia.org/wiki/List_of_first_overall_NFL_draft_picks) and everyone from 2006-2019 except JaMarcus Russell made it 4+ years in the league. The other 13 players drafted 1OA all lasted much longer than 4 years
Is this specifically for players who don’t get benched for their first 4+ years? Or stay 4+ years on the team that drafted them? That could explain the difference
HNCO on
Why do you make the numbers too small to read?
pleetf7 on
Might be nice to normalize y-axis by number of drafts to get a success rate of sorts. Also an average rate per round as a line graph overlay.
TurtleCrusher on
Rounds 6-7 look like draft rounds based on need and have about the same success rate.

![[OC] NFL players who made it 4+ seasons by draft pick (2006-2019)](https://www.byteseu.com/wp-content/uploads/2025/10/6y7i0bmc0msf1-1536x538.png "[OC] NFL players who made it 4+ seasons by draft pick (2006-2019)")
10 Comments
Need more data. Why 2006 cutoff?
data source: [https://github.com/nflverse/nfldata](https://github.com/nflverse/nfldata)
generated with [julius.ai](http://julius.ai)
So much potential here. Maybe aplit x axis into bins?
2006-2019 is 14 drafts. 11 appears to be the high mark on the graph. So at least 3 of every pick didn’t even survive their rookie deal? That seems wrong.
Tom Brady very clearly is not on this chart. 😂
~~Wow, only 25% of even the 1st round picks make it past 4 years.~~
I’m looking at some of the data and I’m not sure I agree. Only 10 first overall picks made it 4 years? I just looked [here](https://en.m.wikipedia.org/wiki/List_of_first_overall_NFL_draft_picks) and everyone from 2006-2019 except JaMarcus Russell made it 4+ years in the league. The other 13 players drafted 1OA all lasted much longer than 4 years
Is this specifically for players who don’t get benched for their first 4+ years? Or stay 4+ years on the team that drafted them? That could explain the difference
Why do you make the numbers too small to read?
Might be nice to normalize y-axis by number of drafts to get a success rate of sorts. Also an average rate per round as a line graph overlay.
Rounds 6-7 look like draft rounds based on need and have about the same success rate.