
![[OC] 12 years of pedestrian fatalities in Albuquerque, with Social Vulnerability Index context (interactive in comments)](https://www.byteseu.com/wp-content/uploads/2025/10/vfzzwzazvnsf1-1024x810.png "[OC] 12 years of pedestrian fatalities in Albuquerque, with Social Vulnerability Index context (interactive in comments)")
Interactive: https://www.sillywimon.com/ped_animation/index_dots.html
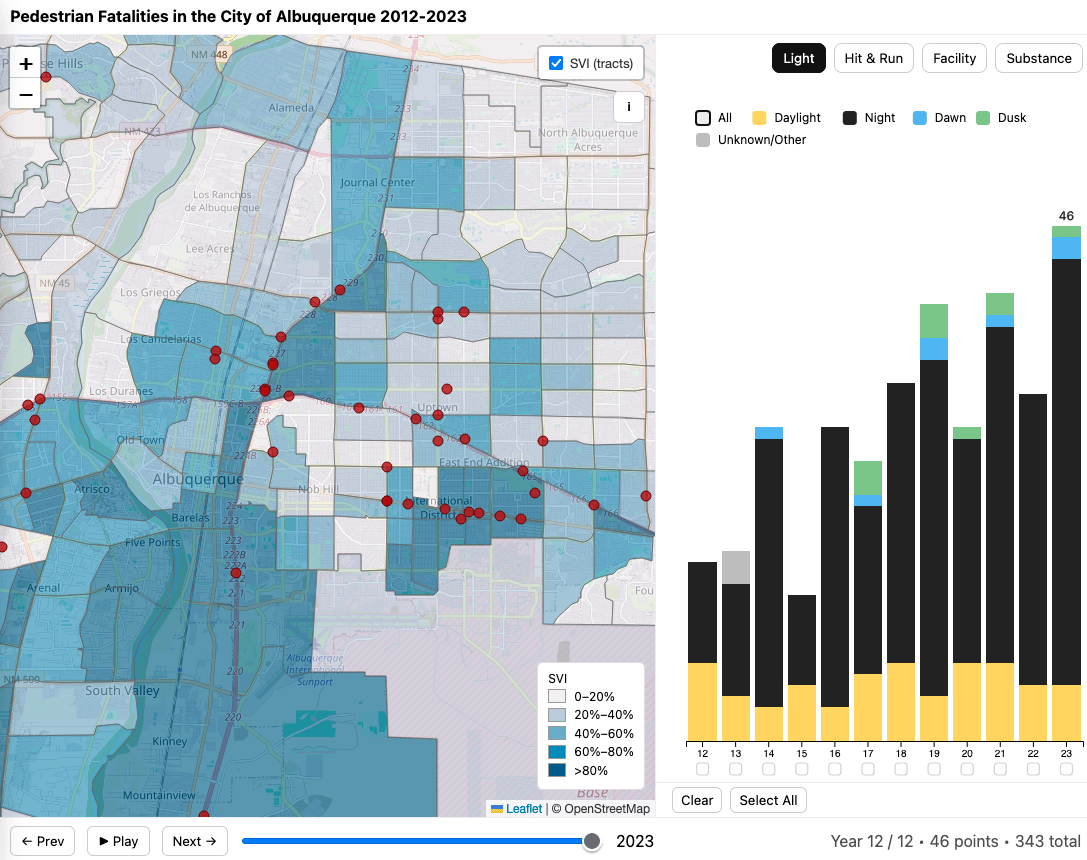
What you’re seeing: An interactive Leaflet map + animated D3 chart of pedestrian fatalities in the City of Albuquerque, 2012–2023. The SVI layer (CDC Social Vulnerability Index) is included to provide neighborhood context.
Quick notes:
- About 14% of Bernalillo County residents live in tracts with SVI ≥ 0.8, yet across 2012–2023 roughly 49% of pedestrian fatalities occurred within or immediately adjacent to those tracts.
- Fatalities involving a hit and run driver are trending up
- Drug involved crashes are trending up while the proportion of alcohol only crashes are trending down
- proportion of crashes occurring on the interstate is going up
Data: NMDOT/City of Albuquerque crash records (cleaned/normalized by me); SVI from CDC (tract-level, RPL_THEMES).
Tools: Leaflet.js, D3.js.
Caveats: Counts subject to reporting/geocoding limits; SVI provides context and does not imply causation.
Code/Method summary: Normalized fields for light conditions, hit-and-run, facility type (lane counts & intersections), and alcohol/drug involvement; bar chart stacks by facet; map points filter by year/facet; SVI choropleth binned at 0.20/0.40/0.60/0.80.
Open to feedback and happy to answer questions or share more details.
Posted by SillyWimon
1 Comment
interactive visualization can be accessed here: [https://www.sillywimon.com/ped_animation/index_dots.html](https://www.sillywimon.com/ped_animation/index_dots.html)
SVI data can be accessed here:
[https://www.atsdr.cdc.gov/place-health/php/svi/svi-data-documentation-download.html](https://www.atsdr.cdc.gov/place-health/php/svi/svi-data-documentation-download.html)
Crash data was obtained via an IPRA request to the City of Albuquerque