
Over the last few weeks, I have been gathering feedback on this visualization's static images. Here is a link to the interactive version that will let you explore a number of different characteristics.
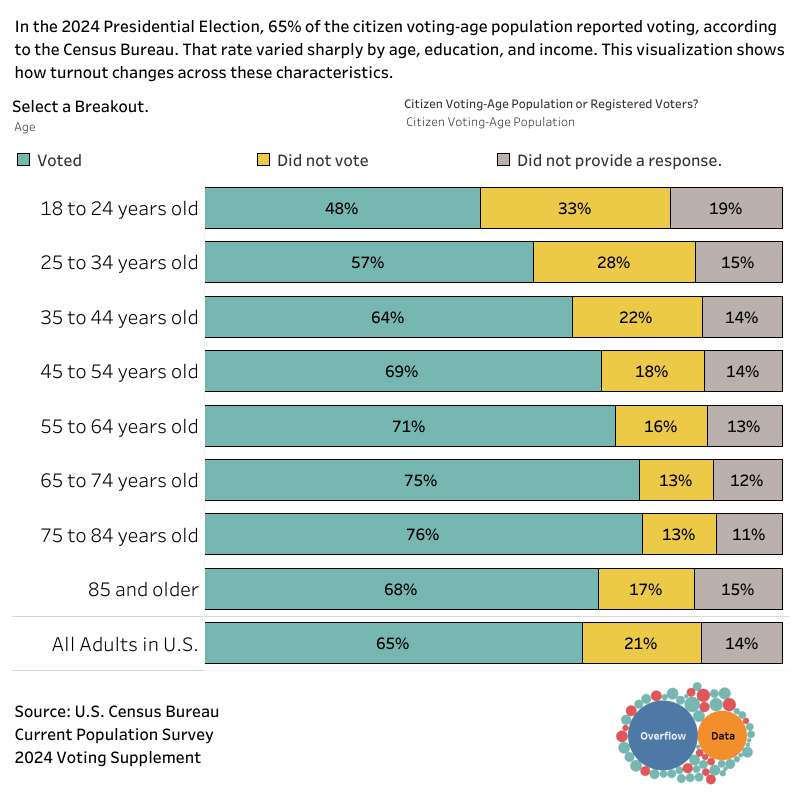
This interactive Tableau visualization lets you explore how these characteristics are related to voting behavior, using data from the Census Bureau's Current Population Survey’s 2024 Voting and Registration Supplement.
Posted by OverflowDs
18 Comments
**Data Source:** [U.S. Census Bureau, CPS November 2024 Voting Supplement](https://www.census.gov/topics/public-sector/voting.html)
**Visualization by:** [Overflow Data](https://overflowdata.com/liberty/breaking-down-voter-turnout-in-the-2024-presidential-election/)
**Tool:** [Tableau](https://public.tableau.com/app/profile/overflowds/vizzes)
It’s just ridiculous. Hospice centers have higher voter turnout than young people? Why won’t my generation vote?
I wonder how much of this is related to disenfranchisement, where they can’t get off work to vote or such similar things that could prevent them.
Would be interesting to know if they didn’t want to vote or for some reason could not.
Trump is the last breath of a dying generation.
Most of the non-voters I know, with respect to national elections, trace their apathy to a two party system in which neither option seems to represent them. I wonder how US voter turnout numbers compare to parliamentary systems where voters have a better chance of finding a candidate who represents their viewpoints.
It would be interesting to limit the data to swing states, otherwise voters may think their vote doesn’t count.
Somewhat related, can analyzing voting data answer this question: Why did 4 states elect a Democratic Senator, when their state voted for Trump? Both require a simple majority, and neither is affected by Congressional districts.
Also, why didn’t the reverse happen (state elected a Republican Senator when that state voted for Harris)?
How does this data change in swing states? In consistently blue/red states, there’s less incentive for people to vote, especially those that are younger with less free time. This is why Trump won the popular vote. A lot of young people in solid blue states didn’t vote due to the lack of incentive from an electoral college system.
“Why aren’t our interests represented??”
Basic math is why. Show up if you want to be counted.
It’s not just your generation. Voting age was lowered to 18 (from 21) in 1971. I’m pretty sure the 18-21 age group has never reached 50% participation in any election.
It’s simple, once you start receiving social security you no longer get to vote.
Which Presidential election?
Oh, I need to see turnout by race over time, especially pre Obama. Is that relatively high White turnout attributable to Trump or is that typical?
They don’t vote, then they blame the “boomers”
And the 18-24 will live with the ramifications for the rest of their lives.
Ok—a dashboard! But I wouldn’t consider this “beautiful data” if I have to configure it myself.
The most telling is when you sort by income. People who don’t struggle show up more to elect people who have never struggled to make rules for the people struggling.
we have the actual data in the voter lists. we dont need surveys.
i feel like im taking crazy pills