
![60 Years of Generational Representation in the U.S. Congress [OC]](https://www.byteseu.com/wp-content/uploads/2025/10/p59e4tx5f8yf1-1536x891.png "60 Years of Generational Representation in the U.S. Congress [OC]")
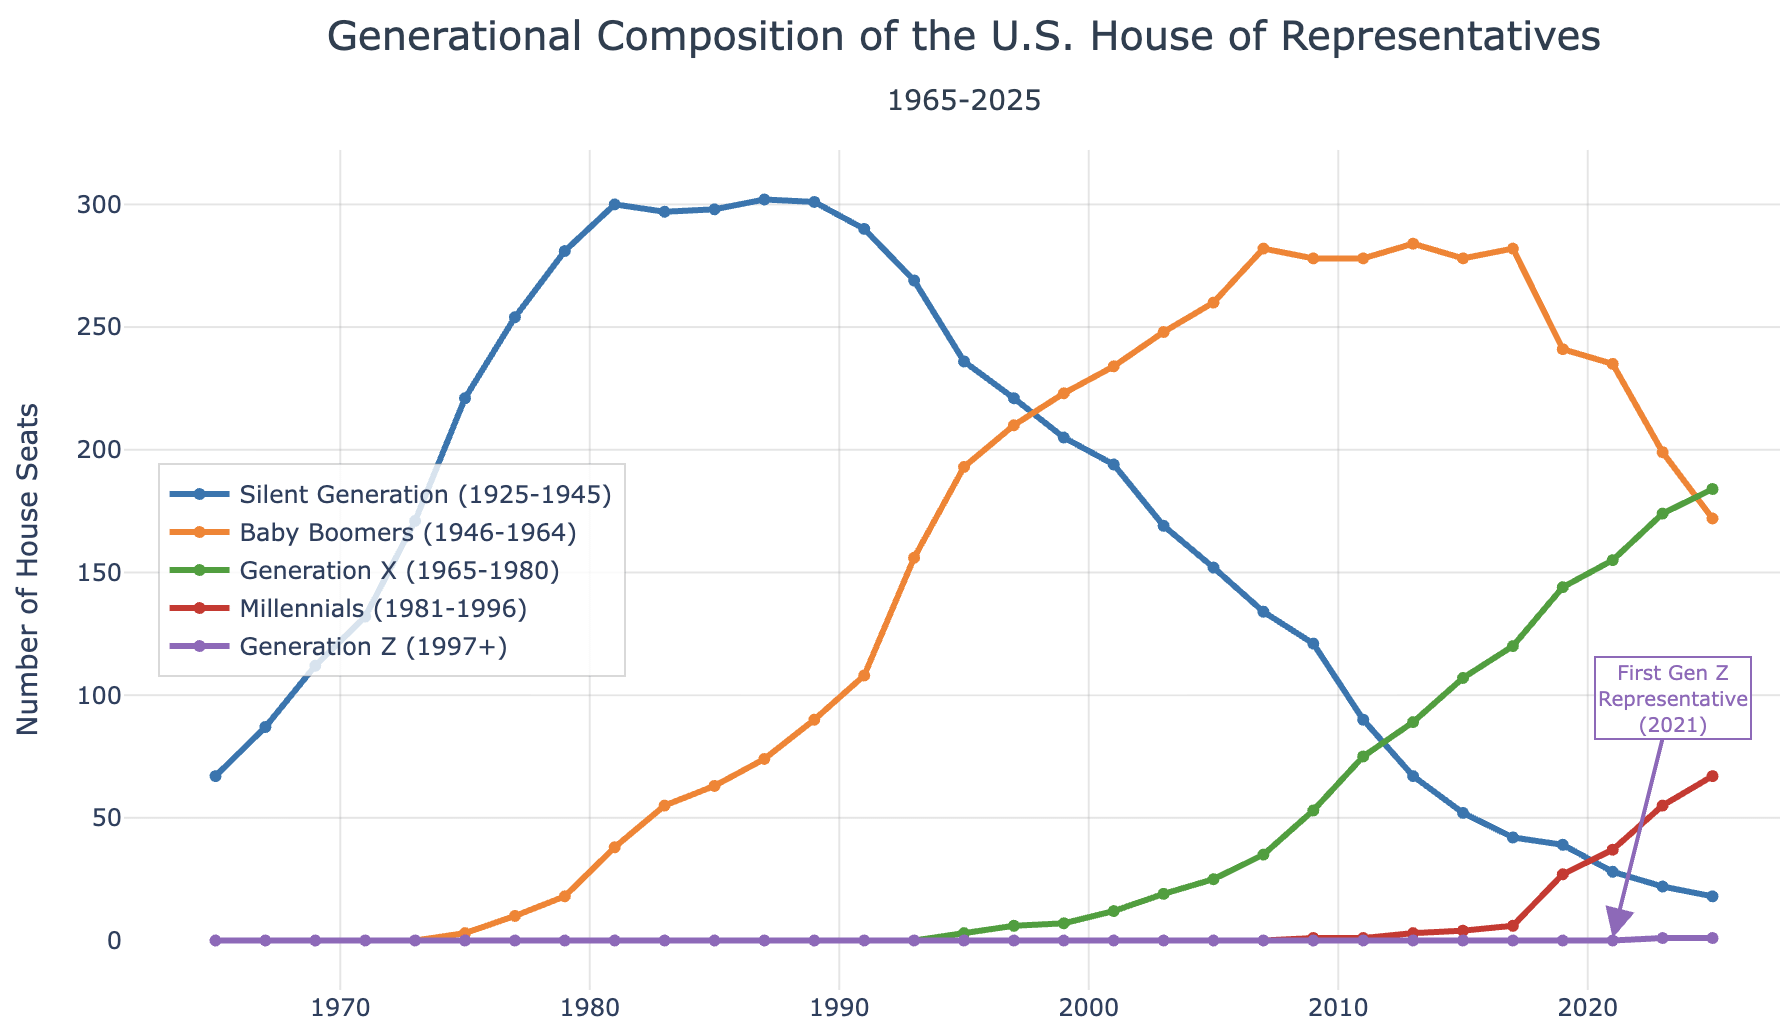
This chart shows the generational composition of the U.S. Congress from 1965 to 2025, based on members’ birth years. Each Congress includes the share of seats held by the Silent Generation, Boomers, Gen X, Millennials, and Gen Z. Gen Z is represented by Maxwell Frost (born 1997) and elected in 2022 to represent a district in Florida.
Posted by DataVizHonduran
8 Comments
Source: [voteview.com](http://voteview.com), Tools: Python and Plotly
If you’re in your 40s, your parents’ generation is still running the country
Really fucked up the lack of GenZ representation in the 80s
(This data would be better if different generations appeared on the chat the year the first of them came to age for congressional seats)
Shouldn’t the purple line begin in 97? And the red line in 81? I get they’re at zero, but it’s a weird choice when this is about representation. Unconsciously implies that gen z has been underrepresented since 65.
Can you contrast this by showing the percentage of the voting population represented by each generation over time.
Gen Xers will be just as clung to power as their baby boomer counterparts. The death of the boomers will not suddenly solve everything.
Get the silent gen out along with the boomers
The 20 year span for the silent and baby boomer generations vs. 15 year span for the other generations distorts the data. It gives the appearance of those earlier generations having even more of an over representation than they already have.
I’d rather see a graph of house member age, animated to show how it has shifted over time.