* Noise reduction
* Ignore games with average Elo (white Elo + black Elo / 2) <1000 and time control <10 minutes
* Ignore players with <20 games
* Ignore games with irregular openings (ECO code A00)
* For each player, compute the distribution of openings played. This will yield a player × ECO matrix (≈500 ECO codes) counting openings as white and black.
* Normalize rows to get per-player opening probability vectors.
* Compute cosine k-NN graph using faiss
* Detect player communities with the Leiden algorithm
* Reduce dimensions to 3D with UMAP
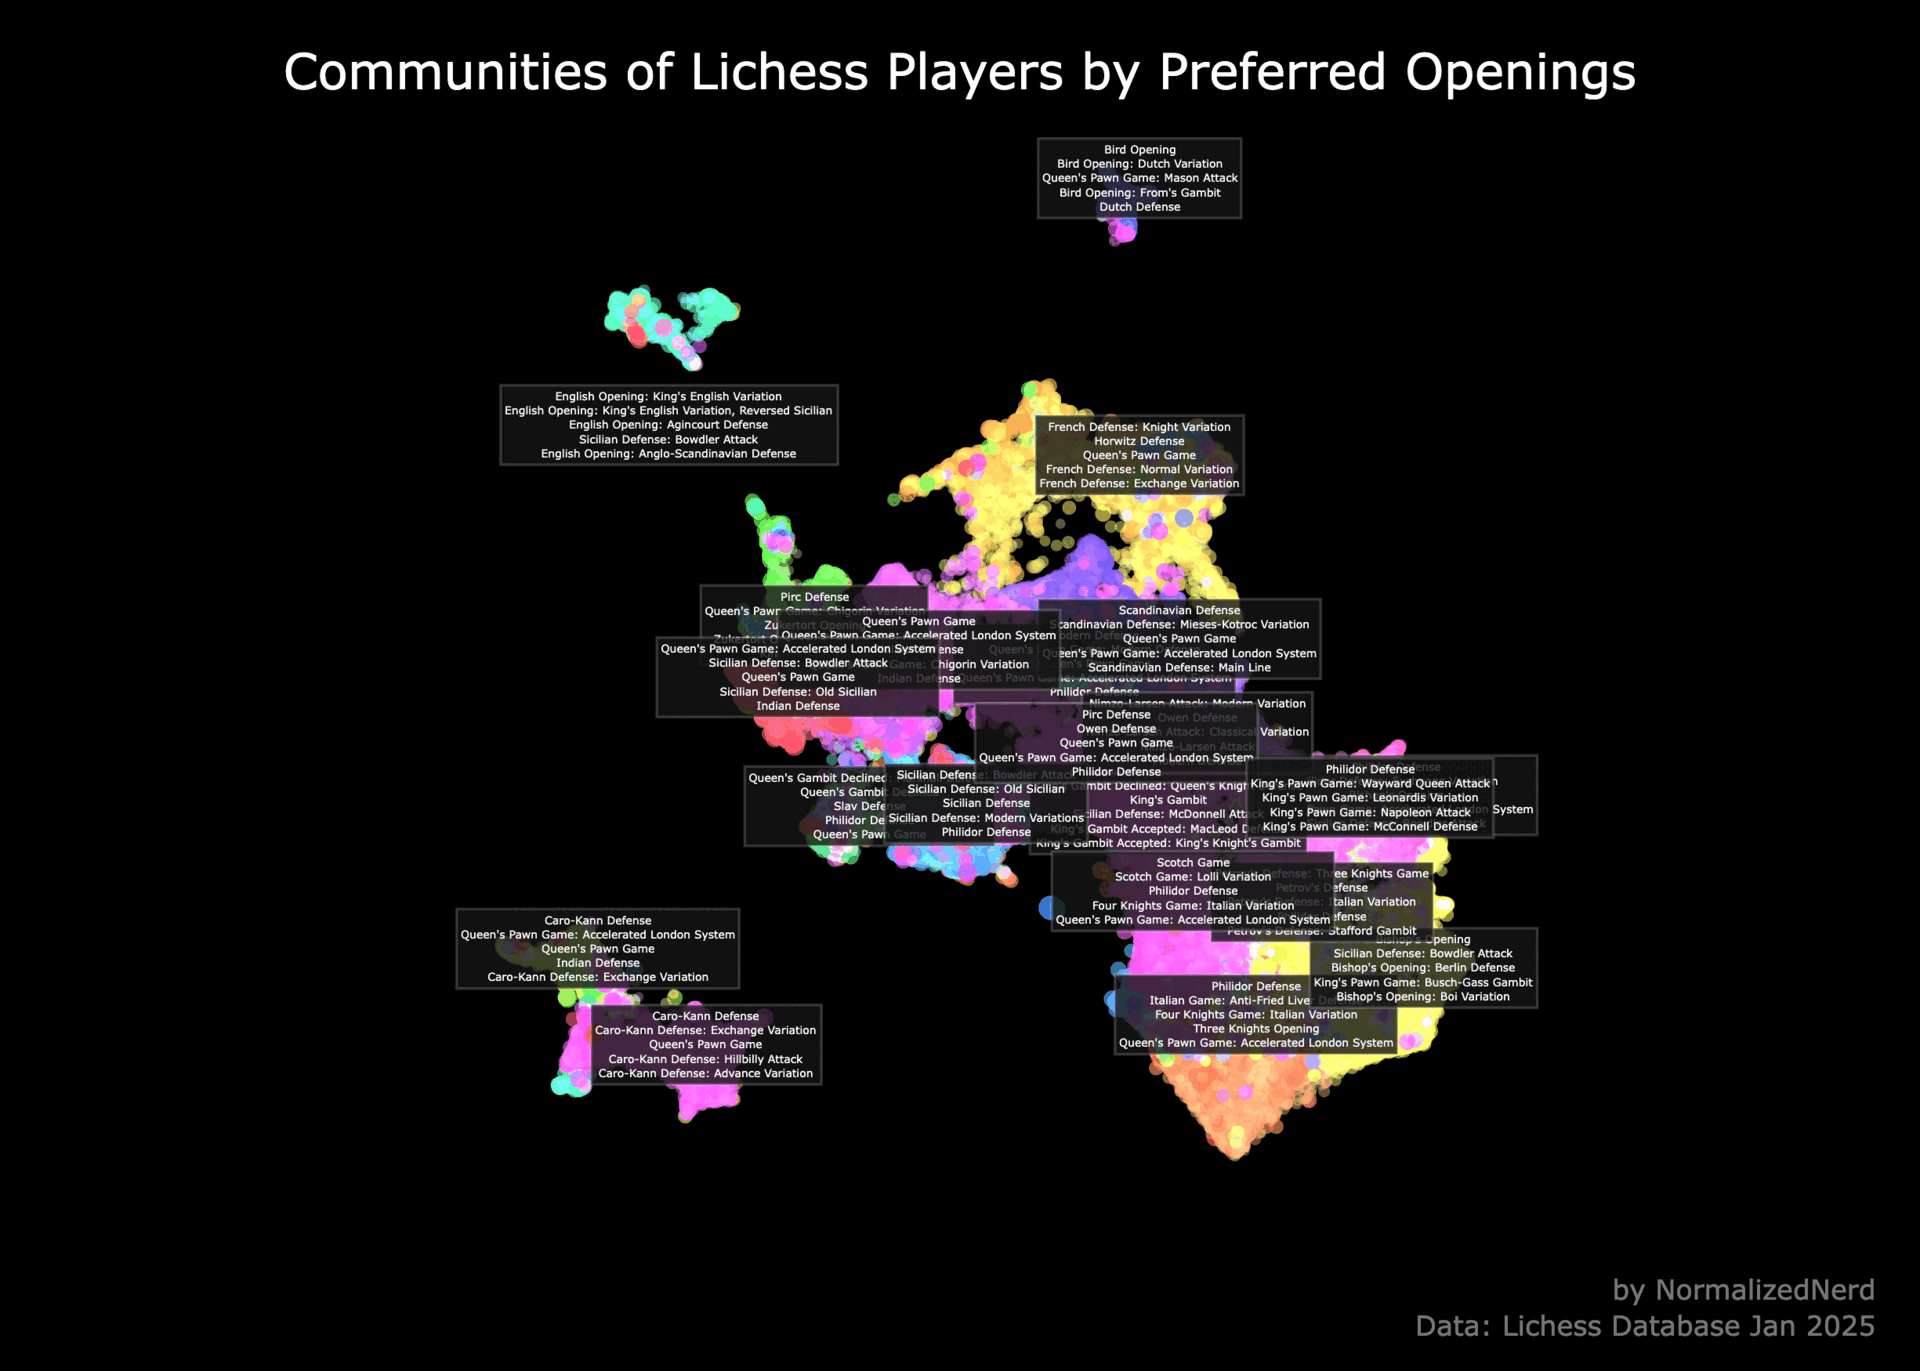
* Visualize randomly sampled 100k players and top 5 openings per cluster for clarity

![[OC] Mapping Lichess Players by Their Opening Choice](https://www.byteseu.com/wp-content/uploads/2025/11/xbda5b53ggzf1-1536x1097.gif "[OC] Mapping Lichess Players by Their Opening Choice")
2 Comments
Interactive Visualization: [https://suji04.github.io/ChessViz/](https://suji04.github.io/ChessViz/)
Methodology
* Noise reduction
* Ignore games with average Elo (white Elo + black Elo / 2) <1000 and time control <10 minutes
* Ignore players with <20 games
* Ignore games with irregular openings (ECO code A00)
* For each player, compute the distribution of openings played. This will yield a player × ECO matrix (≈500 ECO codes) counting openings as white and black.
* Normalize rows to get per-player opening probability vectors.
* Compute cosine k-NN graph using faiss
* Detect player communities with the Leiden algorithm
* Reduce dimensions to 3D with UMAP
* Visualize randomly sampled 100k players and top 5 openings per cluster for clarity
Dataset
[https://database.lichess.org](https://database.lichess.org/) (Jan 2025)
Tools
`python-chess faiss-cpu` `leidenalg umap plotly`
Repo
[https://github.com/Suji04/ChessViz](https://github.com/Suji04/ChessViz)
How many moves does this consider? And does it consider transposition to be the same opening?