
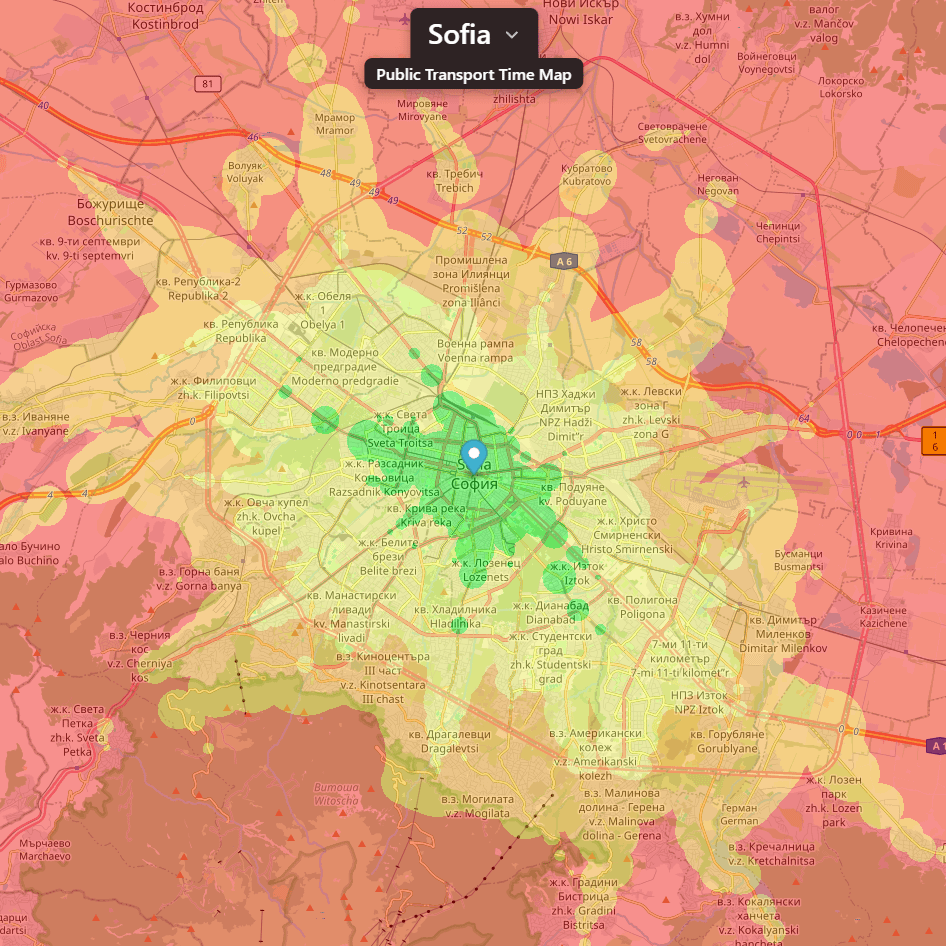
This visualization uses GTFS public transport schedules to show travel time accessibility in Sofia, Bulgaria.
Each map shows how far you can reach by public transport within a fixed time budget, depending on peak vs off‑peak schedules.
Data source: public GTFS feeds.
Posted by Icy-Factor6442
6 Comments
[removed]
No scale included. Green, yellow and red could all mean anything
And the legend is missing, like colors change every hour or 30 minutes?
No legend? “Depending on on-peak vs off-peak”, but only 1 image? Sure this is something you made?
Wow crazy! You can get to the red area in 30 milliseconds??! Amazing public transport
(I’m pulling the legend out of my ass since op forgot to provide it)
I love visualizations like these. A Scale would be nice though. Overall it is beautiful data to me.