
![[OC] I turned bar charts into physical, buildable objects using LEGO bricks](https://www.byteseu.com/wp-content/uploads/2026/01/fbgzdbi8sheg1-1536x1024.png "[OC] I turned bar charts into physical, buildable objects using LEGO bricks")
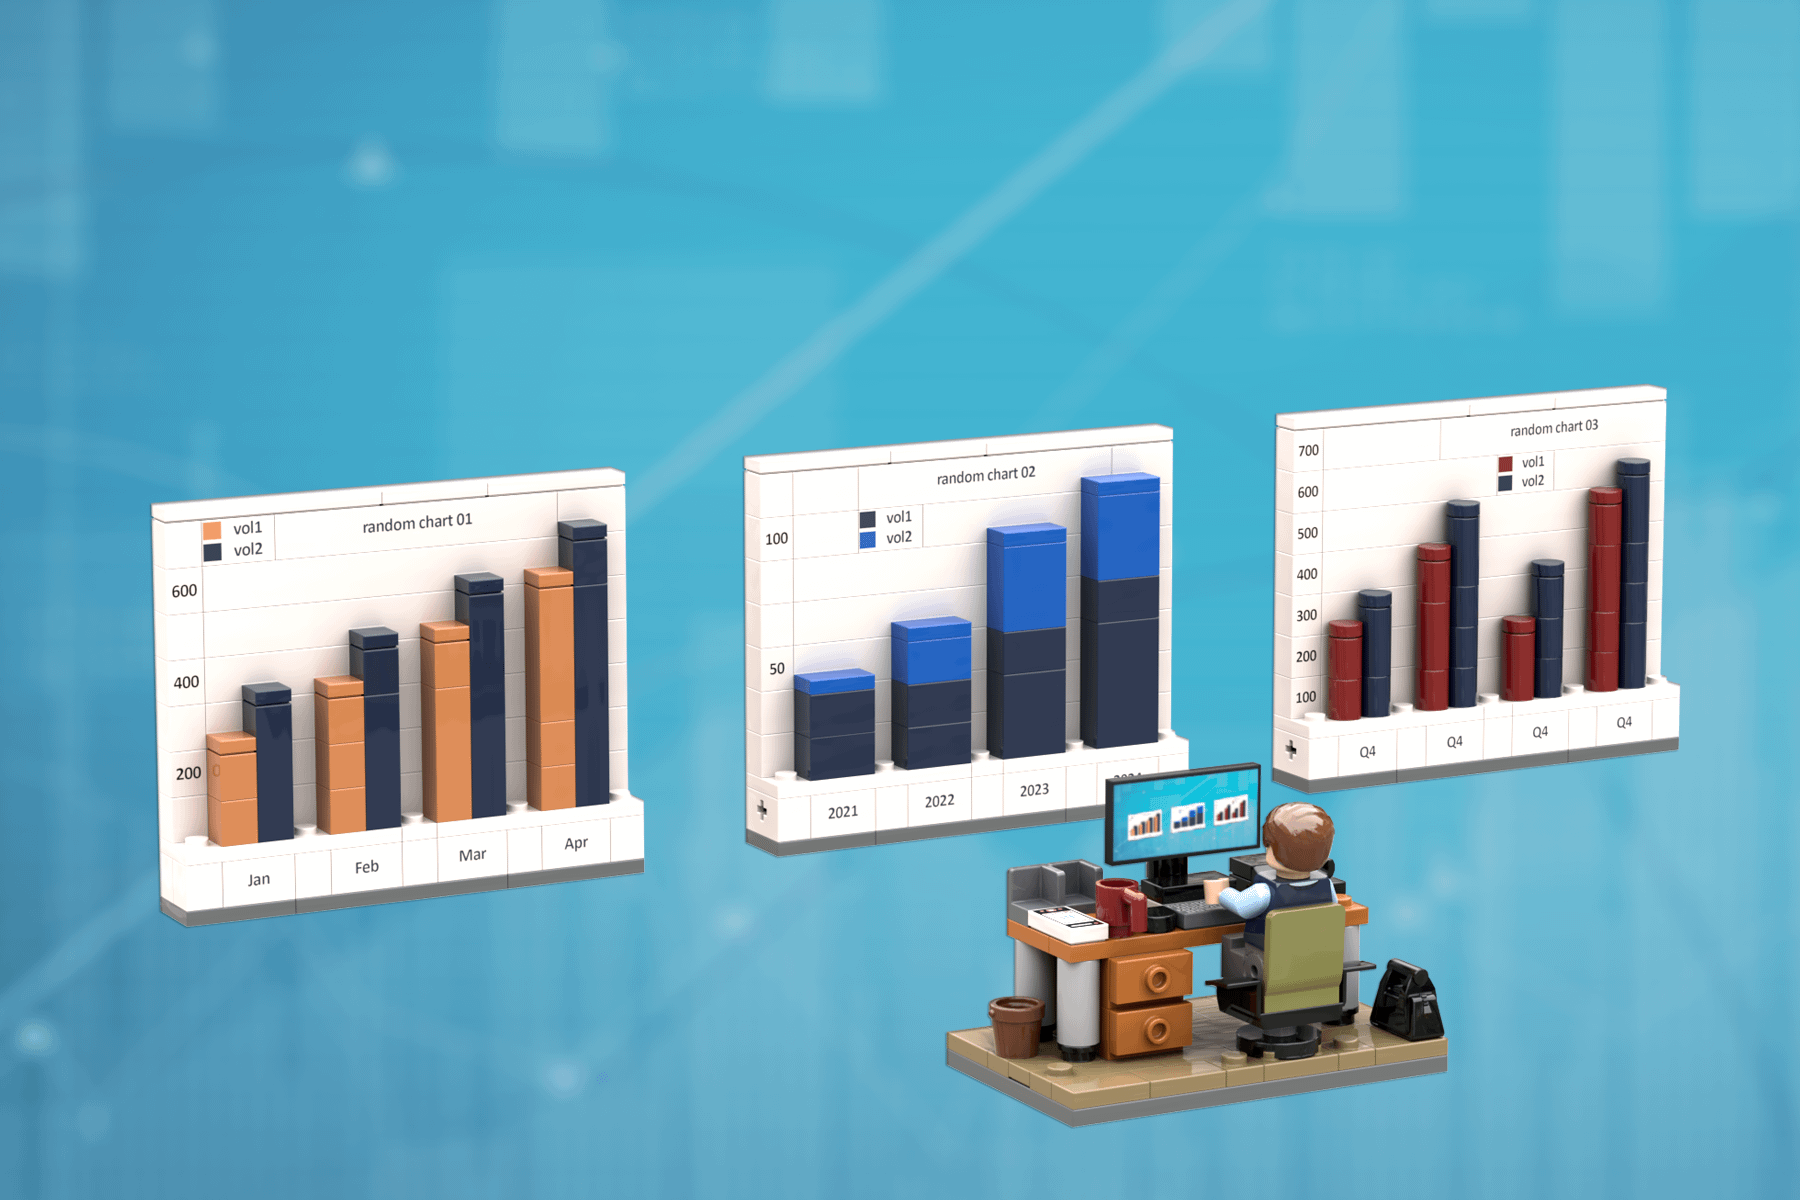
Bar charts are everywhere on screens, so I started wondering: what if you could build and rearrange them physically?
This is a LEGO-based concept where data becomes something you can touch, reconfigure, and display — either on a desk or in a learning environment.
The idea was submitted to LEGO Ideas, which means that if enough people support it, it could become an official LEGO set. So this isn’t just a one-off MOC, but a concept designed to work as a real, producible set.
Originally inspired by data literacy and screen-free learning, with a bit of office humor mixed in.I’m curious how people here feel about physical data visualization.
Posted by lego_zol
3 Comments
Source: Original concept and visualization designed by me. The bar charts represent illustrative example data created specifically to demonstrate physical data visualization using LEGO bricks.
Tool: BrickLink Studio was used to design and render the LEGO models digitally. The concept represents a physical, buildable data visualization.
the real question here is what happened during the 3rd Q4 that stagnated growth in volume?
For those asking: LEGO Ideas is a platform where fan-designed sets can become official LEGO products if they reach enough support. My project is currently there:
[https://beta.ideas.lego.com/product-ideas/885e8037-4841-4b7b-b9a6-0e790beb712f](https://beta.ideas.lego.com/product-ideas/885e8037-4841-4b7b-b9a6-0e790beb712f)