Hi [r/dataisbeautiful](https://www.reddit.com/r/dataisbeautiful/), this is Jake from The Guardian’s audience team. We wanted to share these charts we published today visualizing some key data from the first year of the second Trump administration.
Sources: ICE, US State Department, Bureau of Labor Statistics, Energy Information Administration, Silver Bulliten, and Yahoo Finance
Visualizations made with Adobe Illustator, Datawrapper, and Svelte
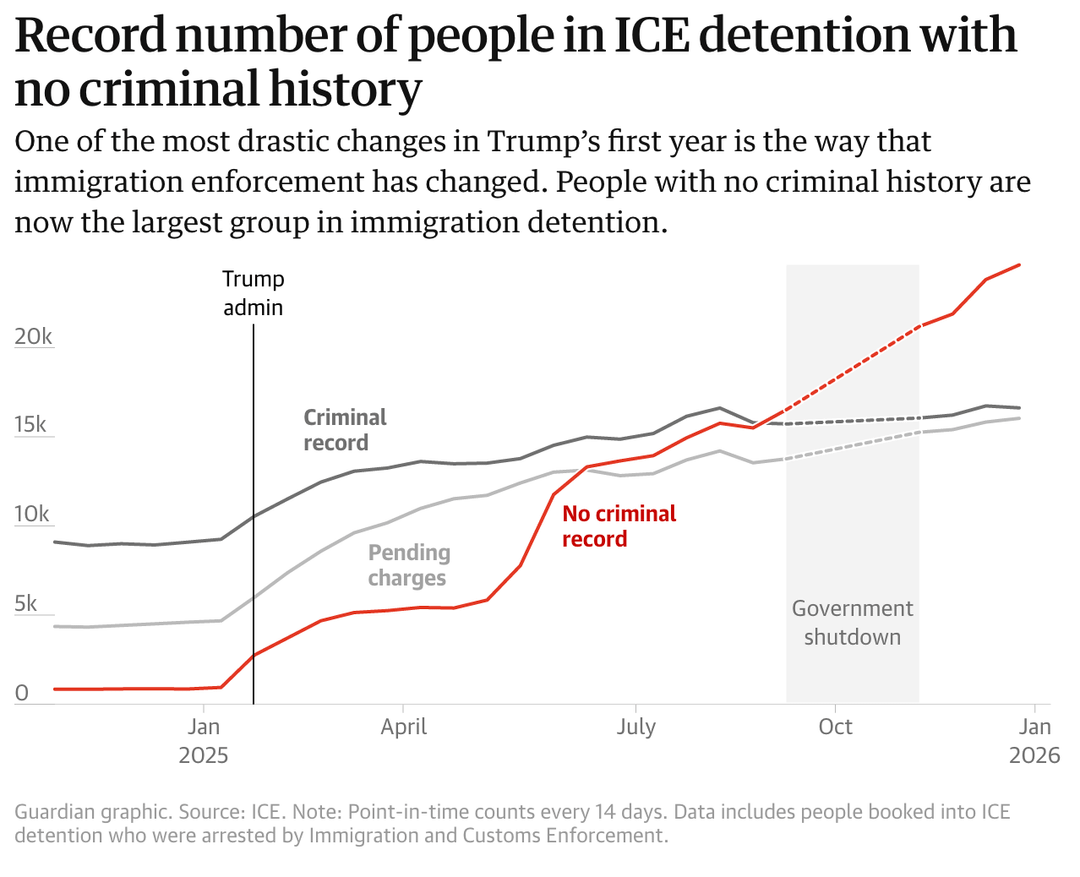
More important I think is the fact that those with a Criminal Record have essentially become flat.
They’ve rounded up the “criminals” and they need to increase non-criminal arrests to keep their narrative going.
Rootfour on
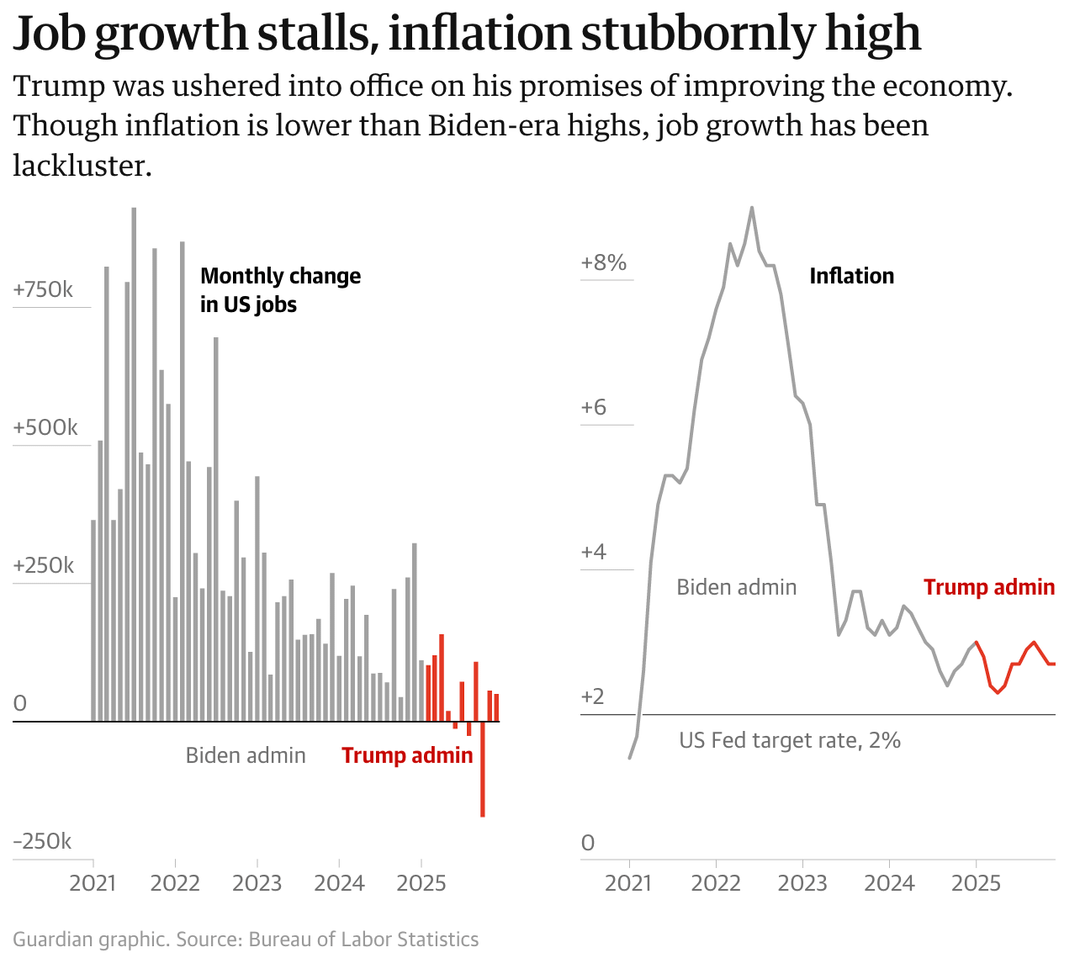
Public jobs vs private? We’ve all seen graphs where jobs number goes up and it’s all in public sector.
LetsGoLesko8 on
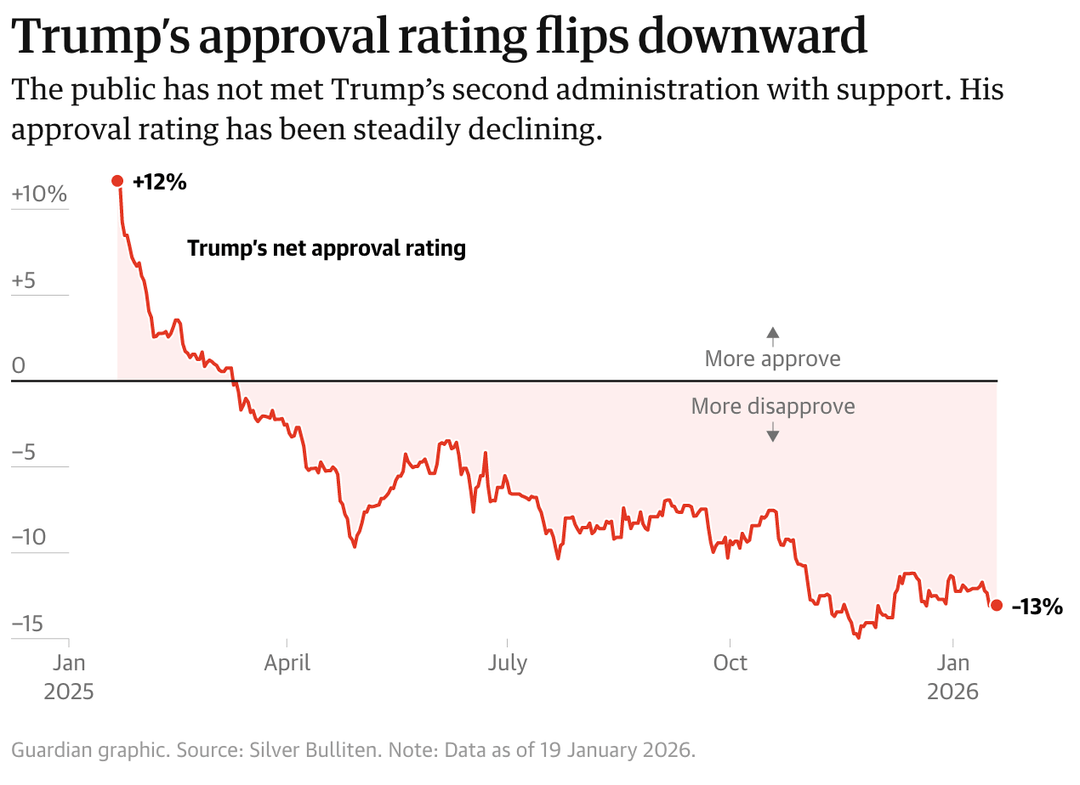
As a non-American, it’s still surprising the level of support he has despite the overwhelming amount of poor data and PR.
Ousis24 on
As non American I have may be few stupid questions. Are these numbers restricted by active deportation? Does this mean that criminals are deported faster? And what are total numbers of processed/captured as these just tell people in detention? Just curious how it works as two lines where flat for half a year
KookyPurchase5622 on
How is employment down when flocks of people got employed by ICE. /s
Difficult-Way-9563 on
It’s the stupid bonuses and incentives. It makes a bad situation worse when they see people as money and even detain/arrest citizens
CristianMR7 on
Illegal immigration is… well, illegal.
Difficult-Cricket541 on
Deportations under Obama were much her and he did it without all this disrespect and show of force. He deported 10 million people. So 2.5 million a year.
Caesar171 on
I was following the line and saw it go dotted and thought to myself “well that trend line is a bit unrealistic” then I saw the solid line start again and I realised what it was…omg
ur_moms_chode on
I’m no fan of DT at all, but it’s incredibly unfair to tout job creation during 2021 given the mass number of COVID job losses in 2020.
It’s also unfair to pin inflation on the Biden administration given the global nature of it and the fact that it was highly caused by COVID stimulus spending.
Accomplished-Rest-89 on
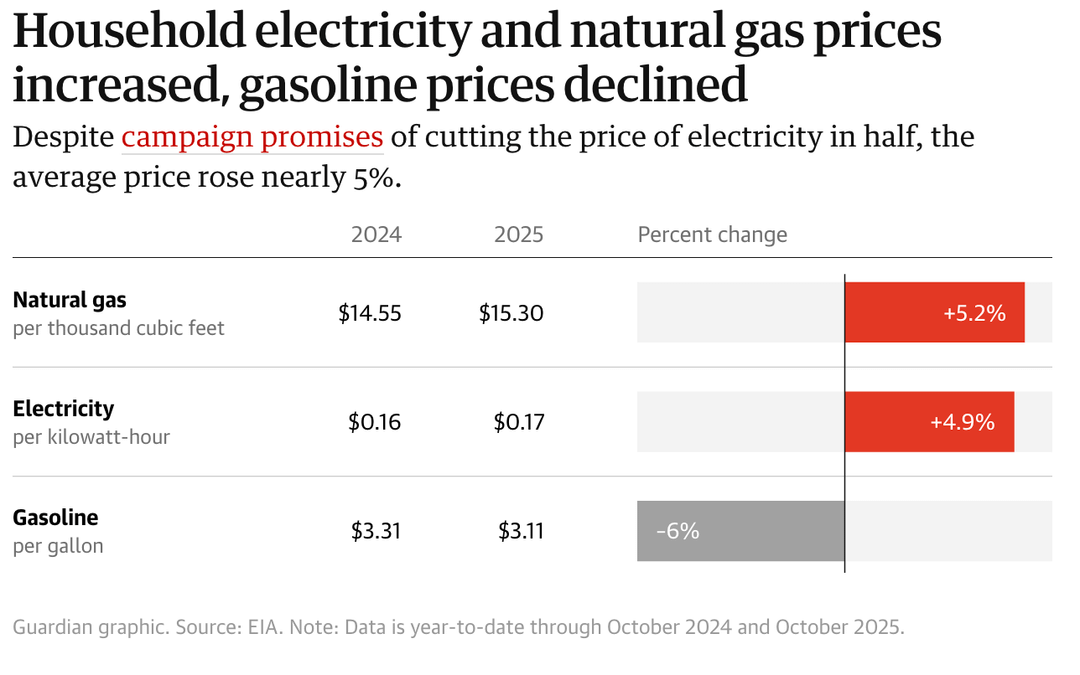
Natural gas and electricity for households are up in the areas where massive investments in net zero infrastructure are mandated by the state and local governments.
For example in Massachusetts the major part (90%) of every Eversource gas and electrical bill is for infrastructure development
TRUEequalsFALSE on
Do… . do you people not understand what it means to enter a country illegally?
wormhole_alien on
There’s an overwhelming amount of bot activity misrepresenting immigration offenses as criminal offenses here. I’m going to correct them on the off chance that a real human interested in learning see this comment:
Immigration offenses are **CIVIL**, not criminal. They can *become* criminal when combined with aggravating factors, but that is not their default status. This administration *is not targeting criminals*. It is instead targeting harmless people (a great many of whom are actively engaged in the process of fixing their legal status) because they are easy targets.
XkF21WNJ on
When you look at the data this way it’s almost as if the shutdown was used to mask the fact that lots of innocent people were being detained.
ineedanewhobbee on
I’m not a fan of Trump or any of his policies, but you are cherry picking data to compare this to post COVID numbers and linking it directly to the Biden Administration as you have done in several charts.
This is a prime example of manipulation of data to try and prove a point. To gain credibility you need to cast a bigger net beyond the post-COVID boom and inflation that was experienced throughout the majority of the developed countries.
rdteets on
Maybe… just maybe… title 42/Joe had something to do with this? Look at this chart… We cant allow these numbers… thats who we shoud be pissed at…
Having a criminal record is not a prerequisite for deportation. Ignore this fact at your own intellectual peril.
Gamer_Grease on
I keep thinking about a passage in Adam Tooze’s *Wages of Destruction,* about the Nazi economy. Great book if you can get through it.
Anyway, he describes the Nazi military buildup before the war, and how essentially it came at the cost of all other consumption. People couldn’t have household appliances like radios, and even pantry staples like flour, sugar, and butter were carefully rationed and were secretly being adulterated to stretch them farther and farther. In other words, ordinary household consumption declined as the military got bigger and stronger.
In the passage I’m thinking of (forgive me, I don’t remember where, but earlier in the book), Tooze posits that for Germans, seeing the military parading around with all their new stuff was a form of consumption in and of itself. Seeing a tank was, for many German families, a substitute for a loaf of bread or simple cake at home, due to nationalistic pride and a sense of things being set right.
He didn’t explore it in-depth, but I’m fascinated by the concept. If you, reading this, have encountered further scholarship about this kind of thing, let me know in reply! But I imagine there are millions of Americans sitting at home, in depressed rural communities, in suburbs where all the young people have left for work because the jobs are gone, in families and social circles where some have been without steady employment for five years; who receive footage of ICE dragging away a family from a church or school like they might enjoy a new car, or a meal at a restaurant, or a new pair of shoes. As the dollar declines, inflation mounts, and cost of living continues to explode in this country, some people might be subconsciously appreciating ICE raids as a substitute for personal and household consumption.
chigaimaro on
One of the main interpreted themes I understood from those charts is that this current administration actively and knowingly hates the everyday working US Americans, but especially hates non-white US Americans; even you do not own a multi-billion dollar corporation life is about to get even worse soon.
WheresWaldo85 on
Wow what a dog shit group of charts.
GDP revised to 4.4% annualized rate. Unemployment is also at 4.4%. No mention.
The charts you’ve put together have a clear agenda and I’m not having it.
decoy777 on
Lol “inflation is high” shows it at 3% compared to it being 8-9% under Biden. If 3 is high then what was that before?
burnmenowz on
They ran out of criminals.
vertigostereo on
The criminal record line is also higher.
Mjtlefebvre on
Does no criminal record take into account they might not be a “criminal” but instead illegally in the country. As I know some people or reporters will say that’s about a criminal act.
guaranic on
Weren’t almost all of those job numbers revised way down? Even the ones for Biden look too high.
AffectionateBus672 on
You voted for him! TWICE! Some people, never learn.

![[OC] Deportations up, job growth down: Trump’s second term so far – in charts](https://www.byteseu.com/wp-content/uploads/2026/01/7f4ig35vcxeg1-1024x832.png "[OC] Deportations up, job growth down: Trump’s second term so far – in charts")
27 Comments
Hi [r/dataisbeautiful](https://www.reddit.com/r/dataisbeautiful/), this is Jake from The Guardian’s audience team. We wanted to share these charts we published today visualizing some key data from the first year of the second Trump administration.
Sources: ICE, US State Department, Bureau of Labor Statistics, Energy Information Administration, Silver Bulliten, and Yahoo Finance
Visualizations made with Adobe Illustator, Datawrapper, and Svelte
[*You can read the full story for free at this link.*](https://www.theguardian.com/us-news/2026/jan/22/trump-first-year-second-term-charts?referring_host=Reddit&utm_campaign=guardianacct)
More important I think is the fact that those with a Criminal Record have essentially become flat.
They’ve rounded up the “criminals” and they need to increase non-criminal arrests to keep their narrative going.
Public jobs vs private? We’ve all seen graphs where jobs number goes up and it’s all in public sector.
As a non-American, it’s still surprising the level of support he has despite the overwhelming amount of poor data and PR.
As non American I have may be few stupid questions. Are these numbers restricted by active deportation? Does this mean that criminals are deported faster? And what are total numbers of processed/captured as these just tell people in detention? Just curious how it works as two lines where flat for half a year
How is employment down when flocks of people got employed by ICE. /s
It’s the stupid bonuses and incentives. It makes a bad situation worse when they see people as money and even detain/arrest citizens
Illegal immigration is… well, illegal.
Deportations under Obama were much her and he did it without all this disrespect and show of force. He deported 10 million people. So 2.5 million a year.
I was following the line and saw it go dotted and thought to myself “well that trend line is a bit unrealistic” then I saw the solid line start again and I realised what it was…omg
I’m no fan of DT at all, but it’s incredibly unfair to tout job creation during 2021 given the mass number of COVID job losses in 2020.
It’s also unfair to pin inflation on the Biden administration given the global nature of it and the fact that it was highly caused by COVID stimulus spending.
Natural gas and electricity for households are up in the areas where massive investments in net zero infrastructure are mandated by the state and local governments.
For example in Massachusetts the major part (90%) of every Eversource gas and electrical bill is for infrastructure development
Do… . do you people not understand what it means to enter a country illegally?
There’s an overwhelming amount of bot activity misrepresenting immigration offenses as criminal offenses here. I’m going to correct them on the off chance that a real human interested in learning see this comment:
Immigration offenses are **CIVIL**, not criminal. They can *become* criminal when combined with aggravating factors, but that is not their default status. This administration *is not targeting criminals*. It is instead targeting harmless people (a great many of whom are actively engaged in the process of fixing their legal status) because they are easy targets.
When you look at the data this way it’s almost as if the shutdown was used to mask the fact that lots of innocent people were being detained.
I’m not a fan of Trump or any of his policies, but you are cherry picking data to compare this to post COVID numbers and linking it directly to the Biden Administration as you have done in several charts.
This is a prime example of manipulation of data to try and prove a point. To gain credibility you need to cast a bigger net beyond the post-COVID boom and inflation that was experienced throughout the majority of the developed countries.
Maybe… just maybe… title 42/Joe had something to do with this? Look at this chart… We cant allow these numbers… thats who we shoud be pissed at…
https://preview.redd.it/gr3rvl7kmxeg1.png?width=1093&format=png&auto=webp&s=ecb8dc738f4f4e094d5042e34d95a3a6a9aa4ed2
Having a criminal record is not a prerequisite for deportation. Ignore this fact at your own intellectual peril.
I keep thinking about a passage in Adam Tooze’s *Wages of Destruction,* about the Nazi economy. Great book if you can get through it.
Anyway, he describes the Nazi military buildup before the war, and how essentially it came at the cost of all other consumption. People couldn’t have household appliances like radios, and even pantry staples like flour, sugar, and butter were carefully rationed and were secretly being adulterated to stretch them farther and farther. In other words, ordinary household consumption declined as the military got bigger and stronger.
In the passage I’m thinking of (forgive me, I don’t remember where, but earlier in the book), Tooze posits that for Germans, seeing the military parading around with all their new stuff was a form of consumption in and of itself. Seeing a tank was, for many German families, a substitute for a loaf of bread or simple cake at home, due to nationalistic pride and a sense of things being set right.
He didn’t explore it in-depth, but I’m fascinated by the concept. If you, reading this, have encountered further scholarship about this kind of thing, let me know in reply! But I imagine there are millions of Americans sitting at home, in depressed rural communities, in suburbs where all the young people have left for work because the jobs are gone, in families and social circles where some have been without steady employment for five years; who receive footage of ICE dragging away a family from a church or school like they might enjoy a new car, or a meal at a restaurant, or a new pair of shoes. As the dollar declines, inflation mounts, and cost of living continues to explode in this country, some people might be subconsciously appreciating ICE raids as a substitute for personal and household consumption.
One of the main interpreted themes I understood from those charts is that this current administration actively and knowingly hates the everyday working US Americans, but especially hates non-white US Americans; even you do not own a multi-billion dollar corporation life is about to get even worse soon.
Wow what a dog shit group of charts.
GDP revised to 4.4% annualized rate. Unemployment is also at 4.4%. No mention.
The charts you’ve put together have a clear agenda and I’m not having it.
Lol “inflation is high” shows it at 3% compared to it being 8-9% under Biden. If 3 is high then what was that before?
They ran out of criminals.
The criminal record line is also higher.
Does no criminal record take into account they might not be a “criminal” but instead illegally in the country. As I know some people or reporters will say that’s about a criminal act.
Weren’t almost all of those job numbers revised way down? Even the ones for Biden look too high.
You voted for him! TWICE! Some people, never learn.