

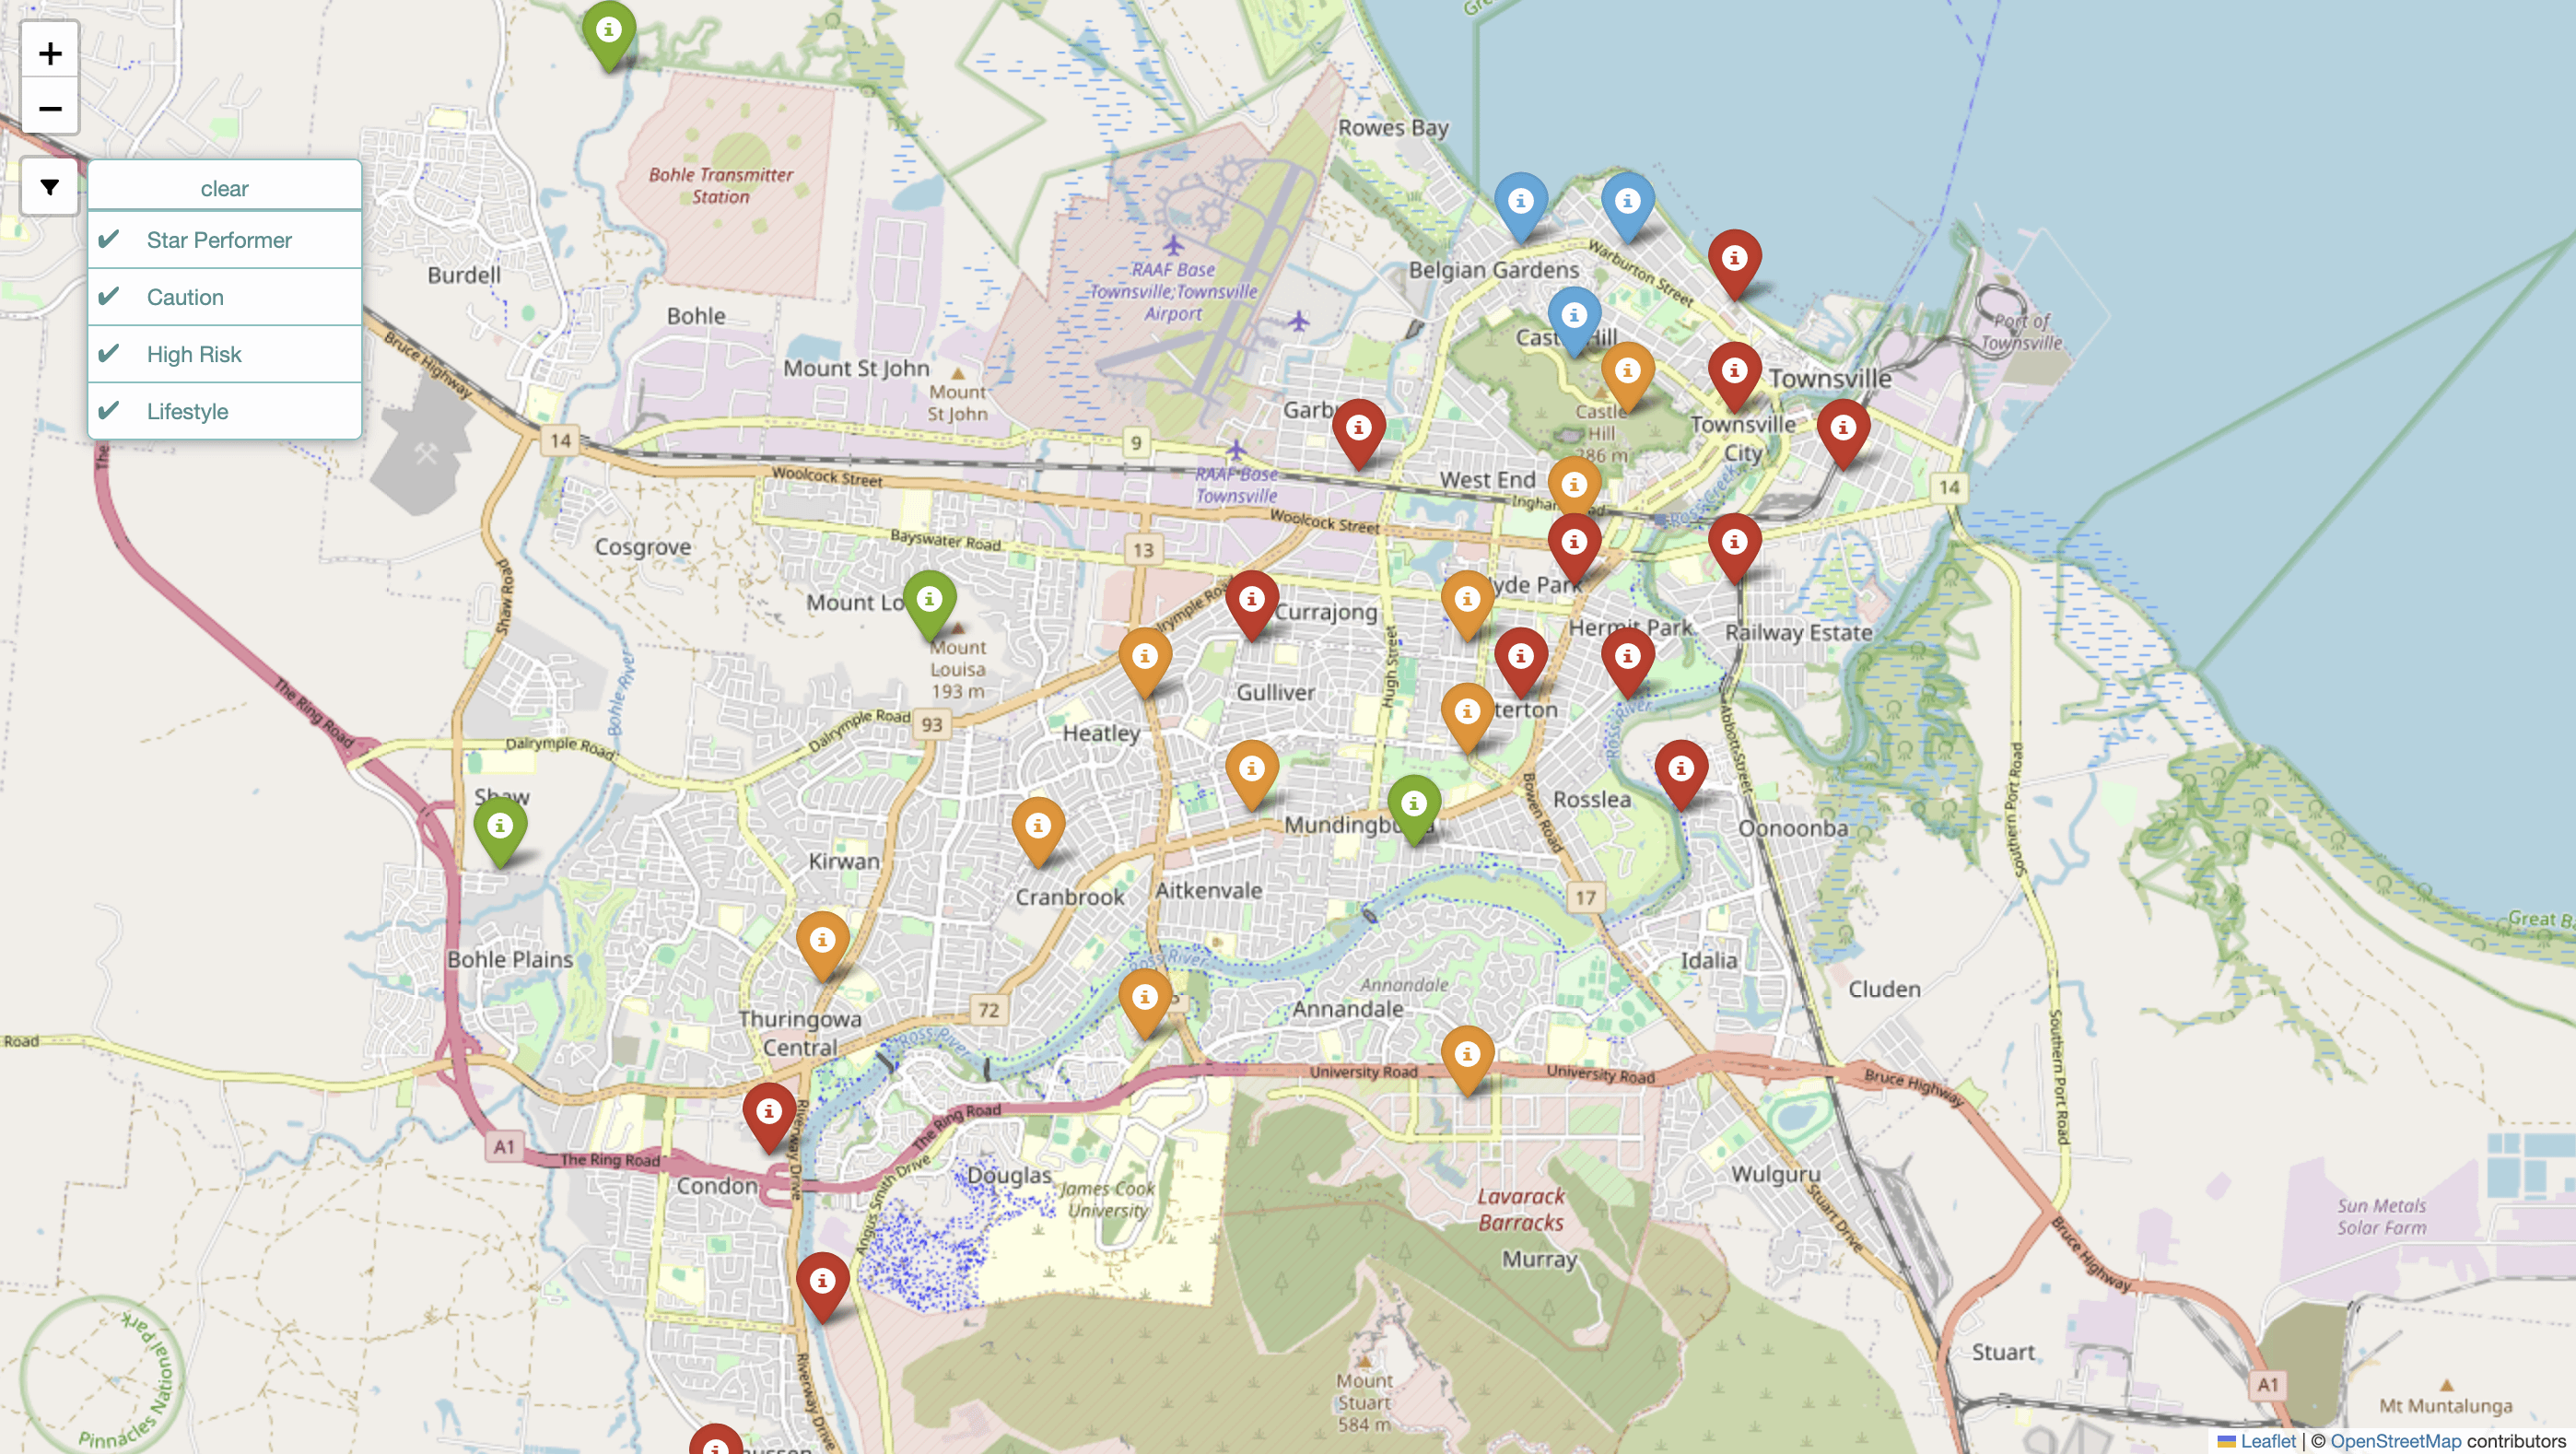
I just finished coding this interactive map for Townsville (overlays Flood zones, Crime hotspots, and Rental Yields).
I'm thinking of porting the code to work for Brisbane next.
Would this actually be useful to anyone here? Or are the BCC maps good enough?
If enough people want it, I'll start scraping the Brisbane data tonight.
Posted by Weak_Recognition_883
17 Comments
Flood *and* crime? How will you know if it’s the Wet Bandits?
I’d say there’s a lot of use for it – especially considering the amount of posts asking for good areas to live in recently
Oi bro
Just tell us if you are using reddit for marketing a website you have already set up
Just add Victoria too and add us to your sales figure one 😉
There’s already a crime map by QPS though no?
[https://qps-ocm.s3-ap-southeast-2.amazonaws.com/index.html](https://qps-ocm.s3-ap-southeast-2.amazonaws.com/index.html)
or [https://www.police.qld.gov.au/maps-and-statistics](https://www.police.qld.gov.au/maps-and-statistics)
Send Melbourne to the front of the queue.
My man’s just trying to sell to people, all this stuff is available for free and pretty easy without paying.
Can there be an option to see race (when known)
If it lowers the rent then sure
These maps already exist and with reliable government data.
I used both those maps when we were buying a house so there is definitely a market out there for people considering buying at x location, if you could include Morton Bay Area maps that would be useful too.
This is a tool that could layer all the realistic risks, basically what the insurance companies use to set your premium. Aggregation of risks to property like flood, stormwater, theft, tide, fire and bush fire, dam failure is probably one to consider as well. There are probably others to scrape into the mix like livability. That way you could look for over or under valued suburbs. Ie scatter plot of risk v house price.
Yes please
Your time mate, if you want to do it, go ahead a see if it works. One thing I ask is make sure you have the infrastructure to run it quickly. I love maps that have heaps of layers but it always drives me bonkers how slow they are to load.
There is no live, public map of actual insurance premiums in Australia, there are three specific “Proxy Maps” that act as near-perfect substitutes. These maps don’t show the dollar figure, but they show the uninsurability risk, which correlates directly to premium cost.
1. The “Uninsurable Nation” Map (Best for QLD)
This is the closest public dataset to what you are asking for. It was produced by the Climate Council using data from Climate Valuation (a risk analytics firm used by banks).
* What it maps: It doesn’t map price; it maps “Risk of Uninsurability.”
* The Metric: It flags properties where the Annual Average Damage (AAD) cost is expected to exceed 1% of the property’s replacement value.
* Rule of Thumb: If AAD > 1%, insurers generally consider the property “uninsurable” or will charge a premium so high it is effectively uninsurable.
* Key Insight: It explicitly names the top 10 most “at-risk” electorates, and 5 of the top 10 are in Queensland (including Griffith, Brisbane, Maranoa, Moncrieff, and Wright).
* Access: Climate Council Risk Map
2. ACCC Northern Australia Insurance Inquiry (The “Official” Heatmaps)
The ACCC conducted a massive inquiry into why premiums in North QLD were skyrocketing. They released static heatmaps that are the only government-verified maps of actual premium costs.
* What it maps: Average insurance premiums for combined home and contents insurance by region.
* The Visual: It divides QLD into zones (North QLD, Central QLD, South East QLD) and shows the average premium price.
* Key Insight: It proved that premiums in North QLD are often 4x to 5x higher than in Brisbane. While not an interactive street-level map, the reports contain the most accurate aggregated pricing data available.
* Access: Look for the ACCC Northern Australia Insurance Inquiry Final Report (specifically the maps in the “Pricing” chapters).
3. Redfin “Risk Factor” (The USA Example)
You asked if other countries have examples. The USA is currently the leader in this transparency, driven by the real estate portal Redfin.
* How it works: Redfin partnered with a non-profit called First Street Foundation. Now, when you look at a house for sale on Redfin, it doesn’t just show the price; it shows a “Flood Factor” and “Fire Factor” score (1-10).
* The Insurance Link: It explicitly estimates “Estimated Insurance Cost” based on these risks. This is the first time a major real estate portal has put “Insurance Premium” data directly onto the “For Sale” listing.
* Why it matters: It is changing buyer behavior. Studies show that homes with a “High Flood Factor” on Redfin are starting to sell for less than comparable homes without the flag.
4. FEMA Flood Insurance Rate Maps (FIRM) – USA
In the US, flood insurance is largely government-subsidized (NFIP). Therefore, the risk map IS the pricing map.
* The Mechanism: If your house is inside a mapped “Special Flood Hazard Area” (Zone A or V), you are legally required to buy insurance, and the price is dictated by a federal rate table.
* Contrast to QLD: In Queensland, insurers can charge whatever they want. In the US (for the NFIP), the map dictates the price.
Summary: How to “DIY” a Premium Map for QLD
Since you cannot download a premium map, you can build a “Red Flag” map that mimics an insurer’s “Do Not Write” list by overlaying these three layers:
* The “1-in-100” Flood Line: (From QRA Flood Check) – Insurers hate this.
* The “Bushfire Impact Buffer”: (From SPP Mapping) – Insurers charge 20-30% more here.
* Postcode Risk: Check the “Uninsurable Nation” list. If the property is in a postcode like 4810 (Townsville), 4700 (Rockhampton), or 4006 (Bowen Hills), assume the premium is double the state average.
Can you add traffic crash data, and fuel prices?
Can’t hurt!
Would you be open to making the code available for use with other locations?