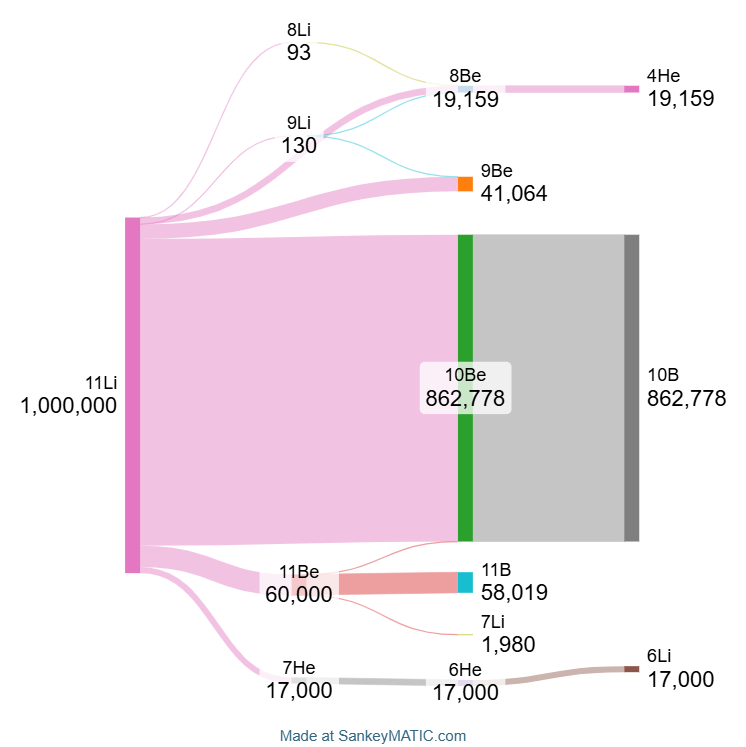
Lithium-11 is an atom with 3 protons and 8 neutrons, an extremely lopsided proton-neutron ratio that results in two neutrons being separated from the "main" nucleus (which is essentially just a lithium-9 nucleus).
Because these neutrons are loosely bound, one or more of them can get ejected from the nucleus as the nucleus decays radioactively. This results in lithium-11 having SEVEN known decay paths, unusually many and more than any smaller nucleus.
If you generated 1,000,000 lithium-11 atoms in god mode and then resumed time, the chart shows the average result you should get. In total, 6 different stable nuclides are produced as products of lithium-11 decay chains (namely 4He, 6Li, 7Li, 9Be, 10B, 11B).
Chart made by myself using data from Wikipedia.
Link to chart:
https://sankeymatic.com/build/?i=PTAEFEDsBcFMCdQDEA2B7A7gZ1AI1tBrLJKAHJoAmsWANKCgJYDWso0AFo1gFwBQIUEOHCAymgCu8AMZsA2gEEAsgHkAqmQAqAXVCaAhvADmBPnwCM5gDKNQc8wHYADC90OAErAvXbcgJwAzLoAHDbeNnbmAU66fmGWEfZ%2BLjGgwQBCXgm%2BACzmKbGZ4b7BAGwATA5VuvlF2XalKamWRXyhvgBUIUVxvqWl3V69dl2gfq0e8qOlnnwzU7qlYW2ZI7o5s7ULoLXeq%2DY1TnXm%2B%2BZ%2BwakO8SfbLXxYjABebBigjU58oBxvLnwAtoYjIxSCgduVPohzOD2Dtgp9cKByh9cEZQNI0OhEABiABmePxn2g8H0kCwAAdDCRoOQ%2BJAqC8wZ9vgBWD6gcn6aTA1EOZnwtDwaiINmcWB%2DNj6T7ozGgLHBeUKz5oClc6AATx2fBx6Fe0ikADd9NApGwnAA6PmgYEcBCMaA4%2BBoP6gSTQB7UAC0wKlGIFsr8AcDSpVdo15pyfJQ%2BjVrpdgoQoH0EmgTqNjGknwAVhIsNBGDiY%2DBGEDSTTQNnc%2Dm1SRKDgyBDYPqEFhYEZiWTvvXE9BoJyuJB0X8ySgCDQU6BILBKbm%2BFH8CgcNK%2DVimr8voxqGWuEYOEwd9TzbzPji0DAcZy2FgSVgPS2izjPkxJxyuZBUebofBYFG802Hs8dnyT4ASMSAqx2X452%2DSB9HFRMyTJKd4BwABNT5%2DzYcxSk%2BIhiw4akckg%2DR50NFAJAlBCkNQ48JBQFAyS%2DLkHlPUA0NAMk0AePMWPnTAcNgPCCKI%2BcOK4xgWKTFN9D3Ug2SwaQbTgyS0GPRhkOpfATy%2DeEv30ZgOOBak%2BVI8jQC0gFqQAcloM1LM%2BBjYBxRgAA9QEsuz2QkPEXLcuzRXFNA8Rbal9DeeFQDZaQIs%2BShovFXtQHFGBxNJElWDVCz01Yx9uDzP5cGkklZGov40CbUBJgi%2BhzShPxygCf4yswm4qtAD1zScPxHD5UryvmVqaoCUo8ka8qWla9qzXMZlmWCcFerYJZbCcaqpqw%2DogA
Posted by Fantastic_Strain_425

23 Comments
Chart made by myself using data from Wikipedia.
Decay data from:
[https://en.wikipedia.org/wiki/Isotopes_of_lithium](https://en.wikipedia.org/wiki/Isotopes_of_lithium)
[https://en.wikipedia.org/wiki/Isotopes_of_beryllium](https://en.wikipedia.org/wiki/Isotopes_of_beryllium)
[https://en.wikipedia.org/wiki/Isotopes_of_boron](https://en.wikipedia.org/wiki/Isotopes_of_boron)
Chart made using SankeyMATIC (link is available in post)
This is one of the most creative uses for a Sankey diagram I’ve seen
Now THAT’S what I call an interesting Sankey.
Well done!
Oh no. The dating/job hunt graphic is spreading
Well that is the most hilariously valid and useful ways to use a Sankey I’ve ever seen lol
now this is actually cool
We’re you using Hinge premium?
Is this the theoretical distribution or the result of simulating this distribution with 1,000,000 samples. Do the numbers represent probabilities or just the results of a random draw?
Such a nice and interesting way to put it!!
As a chemist, this is freakin awesome to see! Well done!
FINALLY a good Sankey. You love to see it
But how many of those released into the fluffer?
Wow, what a great way to show decay products in their relative appearance!
Lots of beta radiation there…
How does 862,778 10Be plus one 11Be become 862,778 10B?
Finally an interesting Sankey
that’s a odd tinder self report chart
How may dates did you get tho?
This is a smart use of such a diagram. You could do every isotope like this.
This is pretty cool, I’d suggest making the width of the flows correspond to the half life of each element (on a log scale)
Can someone please make “Chronus Eating His Children” with a Sankey diagram?
OP, I have a doubt. If this is only the decay of 1,000,000 Lithium-11 atoms, how is the number of protons in the products (4,863,499) greater than the number of protons in 1,000,000 Lithium-11 atoms (3,000,000)? Could you please explain?
You swiped a million times and only had 17,000 6Li? What was going on in those chats
I don’t like this diagram very much. The connecting lines vary in thickness to much to be comparable by eye. So you need to read the numbers. But then the diagram only gives the number per nucleus, not per process. So you can’t tell how it’s split up if multiple nuclei lead to the same nucleus. Also, neither the x-axis nor the y-axis nor the colours seem to represent anything.
And that’s even though there are some things about that process that could stand to be represented, such as the weights of the decay products (maybe that could be the y-axis), the decay rates of the various processes (that could maybe be the distance on the x-axis).
I would have also like to see the type of process represented, but I guess it’s getting a bit overloaded by now.