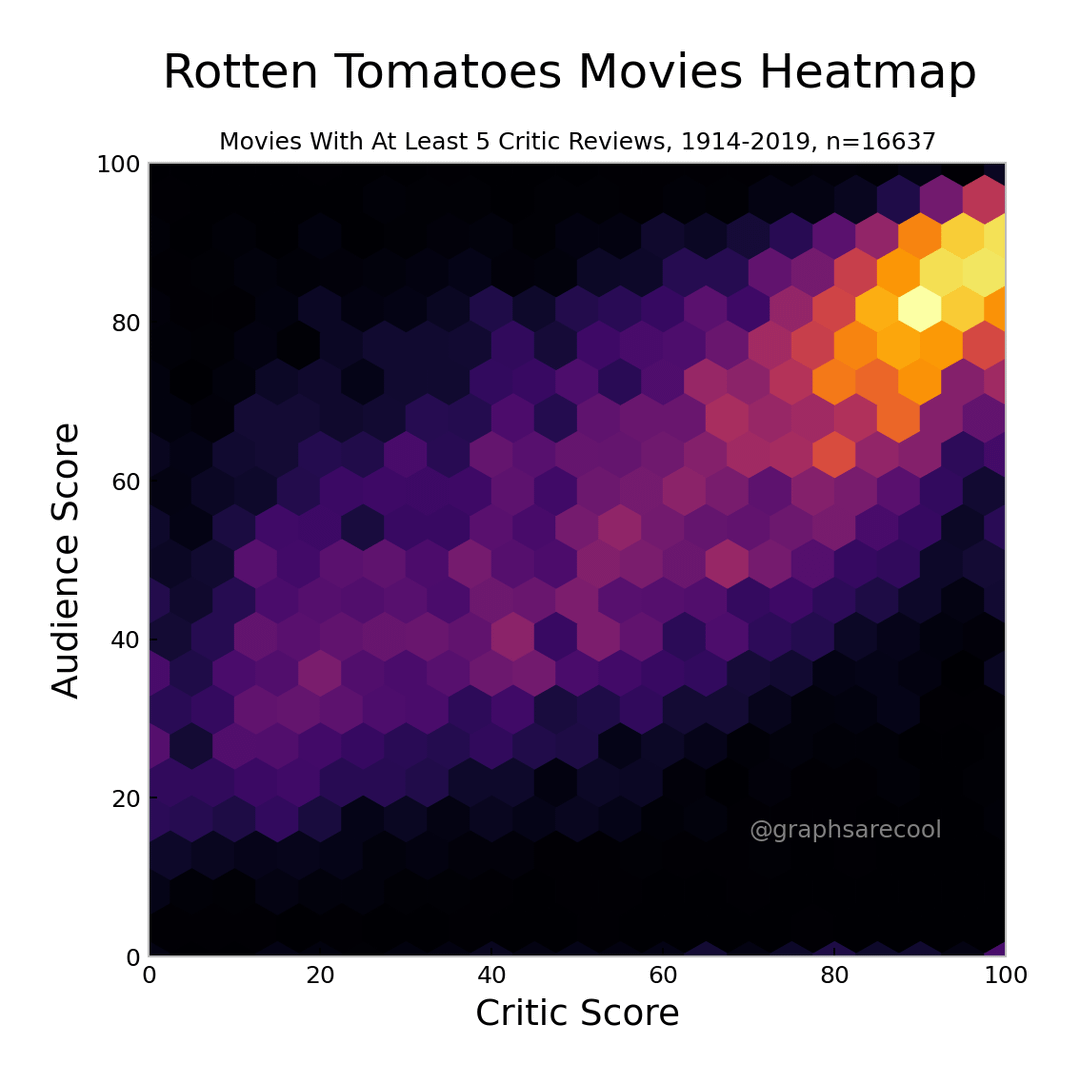
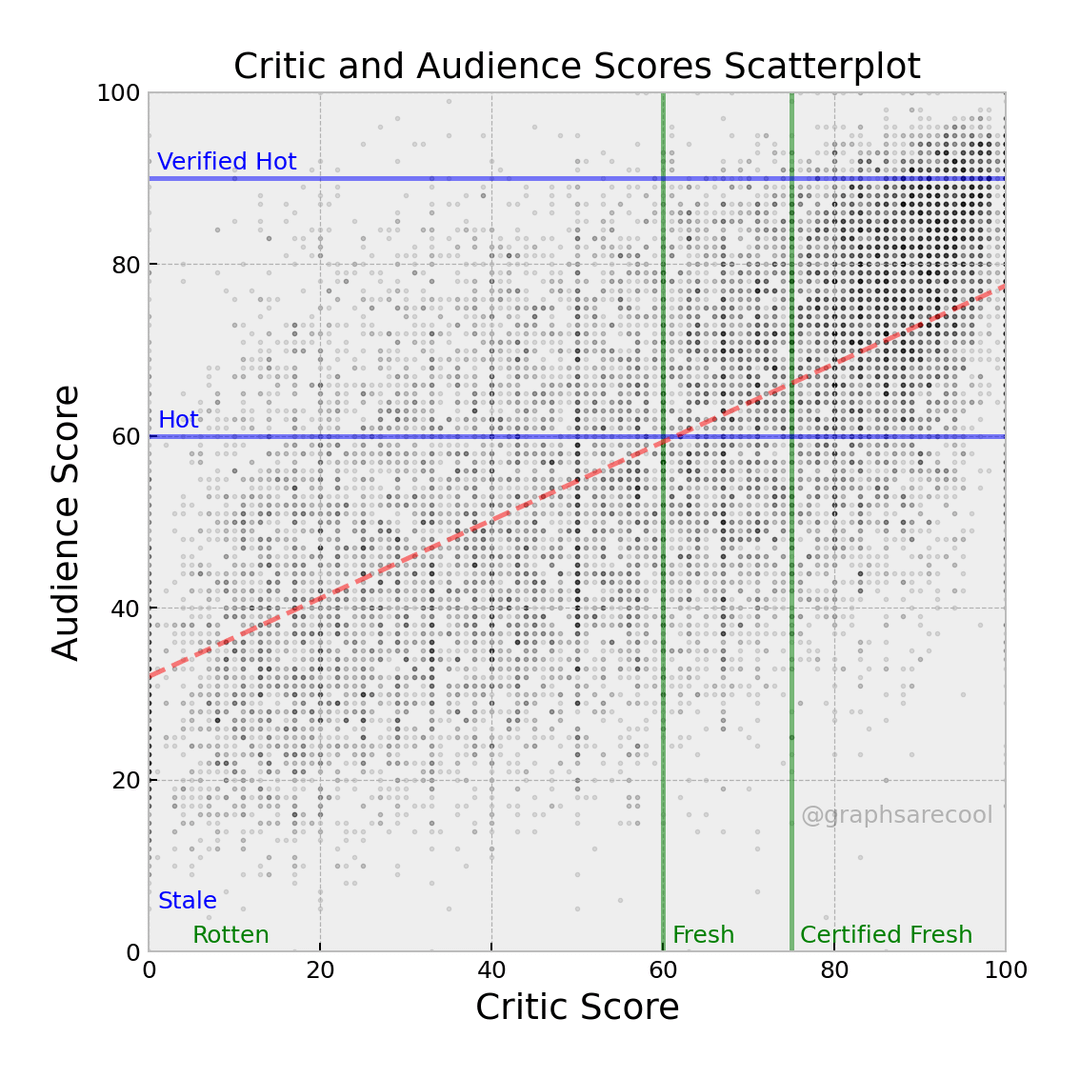
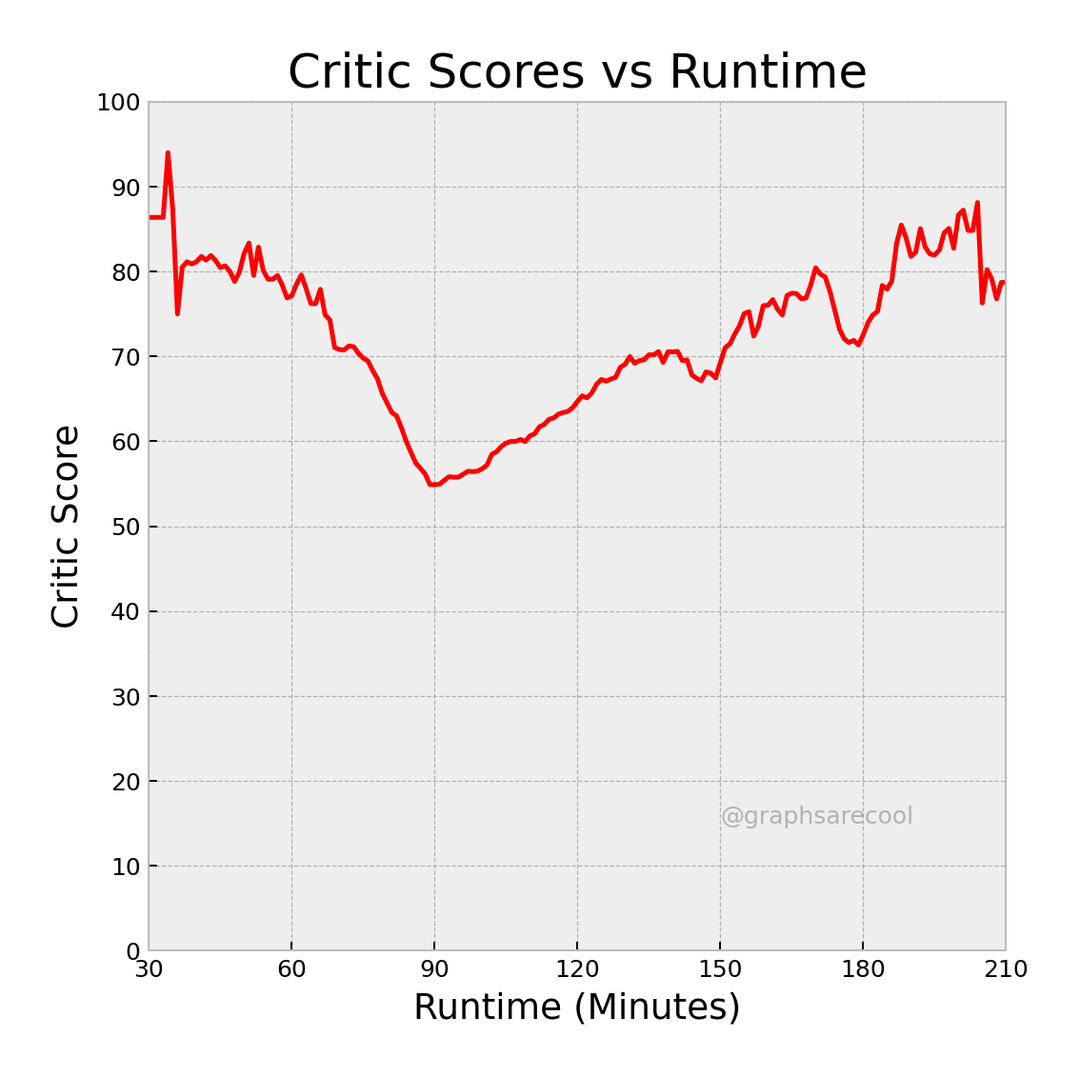
Audience and critic scores plotted against various data, about 17,000 movies with at least 5 critic reviews. Thresholds for Rotten Tomatoes ratings are plotted on graph 2.
Posted by graphsarecool

![Rotten Tomatoes Movies Audience and Critic Scores [OC]](https://www.byteseu.com/wp-content/uploads/2026/02/q0ilro2lechg1-1021x1024.png "Rotten Tomatoes Movies Audience and Critic Scores [OC]")
Audience and critic scores plotted against various data, about 17,000 movies with at least 5 critic reviews. Thresholds for Rotten Tomatoes ratings are plotted on graph 2.
Posted by graphsarecool
9 Comments
Source: [rottentomatoes.com](http://rottentomatoes.com/), data from [https://www.kaggle.com/datasets/subhajournal/movie-rating](https://www.kaggle.com/datasets/subhajournal/movie-rating).
Tools: Python with NumPy and matplotlib.
Aaand then there’s ‘Melania’.
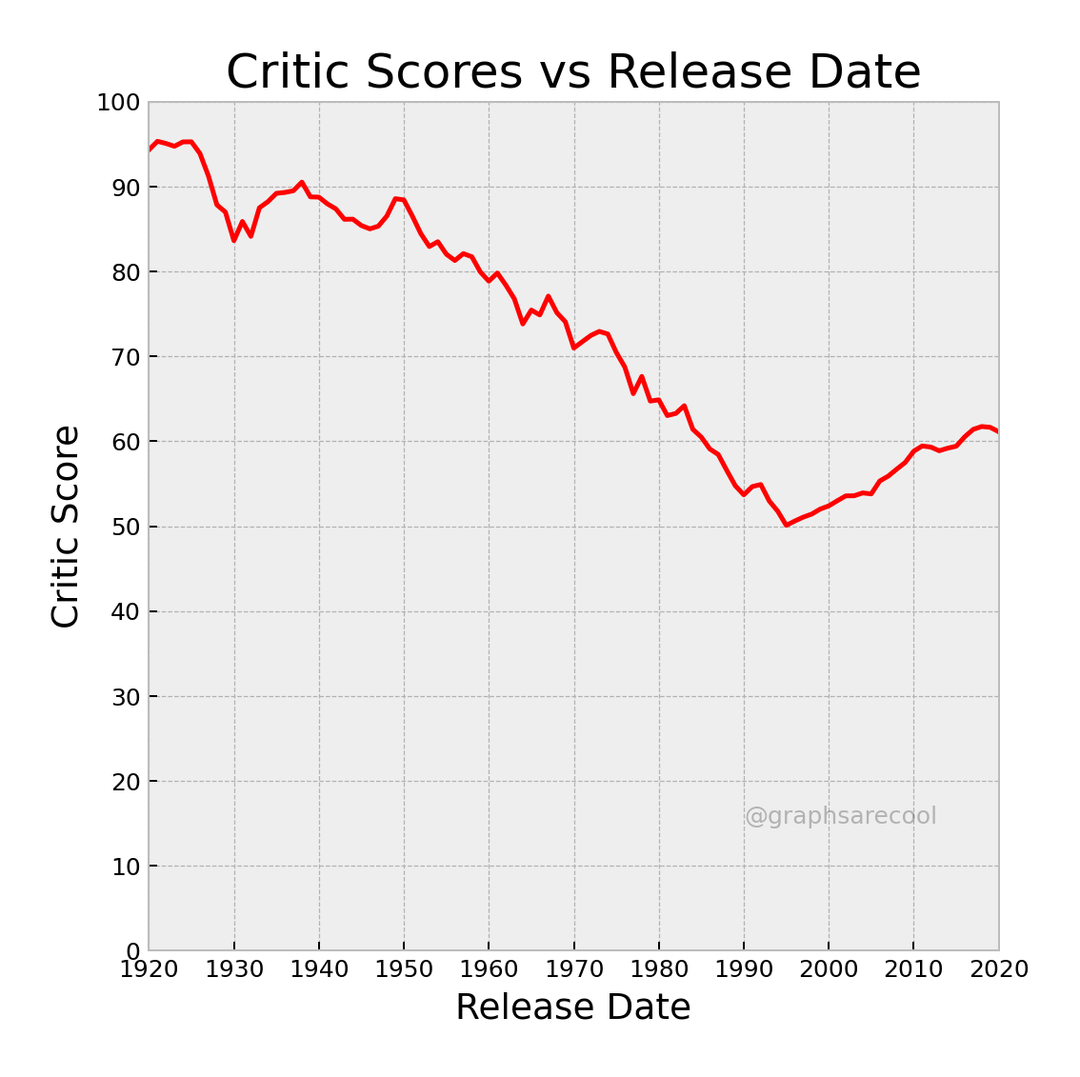
Probably some selection bias with score vs release date, people aren’t going to bother to fill entries for old, bad movies
Did you include this one?
https://preview.redd.it/h34hol2ifchg1.png?width=1170&format=png&auto=webp&s=7dc31df67c8ec47677ece93ee867adc41c9d7506
The trends here are genuinely fascinating.
Also 1995 was a real watershed year it seems
Edit: 88 minutes is a real thing too. Wild
Beautiful. Thanks for presenting data in a beautiful way.
How did you plot in hex?
Overall decent enough, though I wish more work went into making these into actually interesting infographics or something, rather than taking the outputs of a graphing library and more or less calling it a day.
But the thing that bothers me is you really need to give more information on the graph showing critic scores going back 100 years. That kind of thing deeply matters and adds valuable context to why that graph may look the way it does. That’s the kind of thing that makes me wary about how much effort was put into this project.
First graph is poor data, needs a key , what does a hexagon represent?
Crazy that 90 minutes is the perfect run time but the vertex of critic scores.