
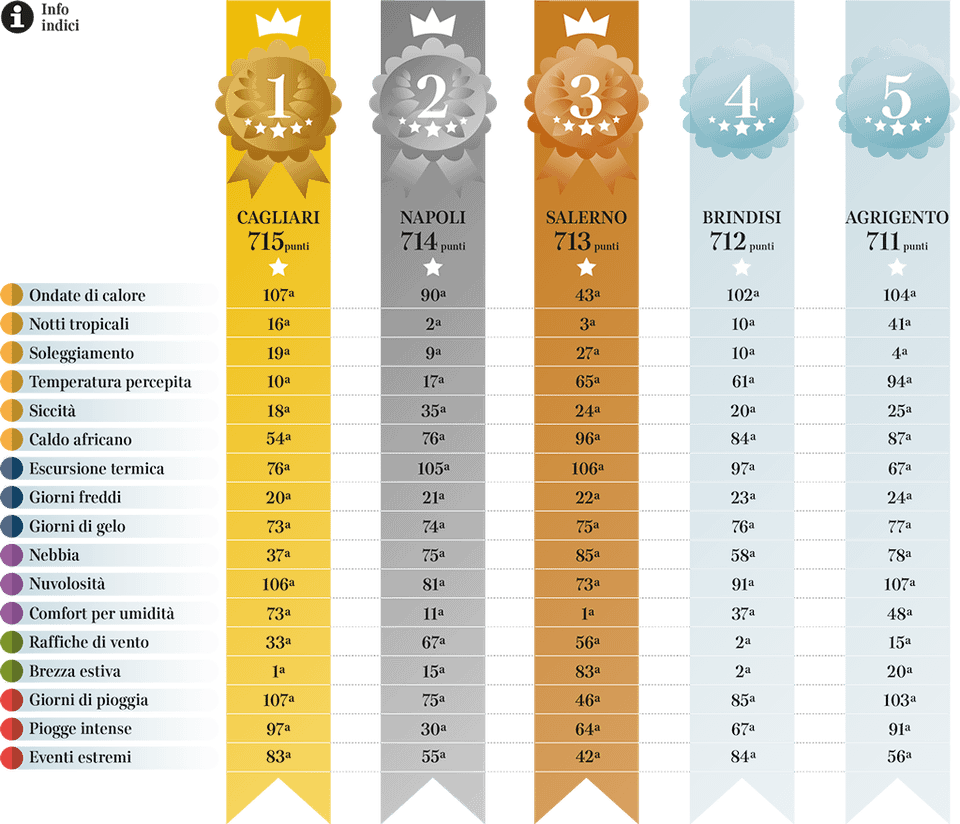
Here are all the details for each city: https://www.corriere.it/cronache/indice-climatico-italia/
Tl;dr
created with iLMeteo.it, the index uses 17 parameters including temperature, rain, humidity and extreme events. 402 million data also analyzed with artificial intelligence
Last year was the hottest ever in our country, with an average temperature of 1.36 degrees higher than the 1991-2020 climate reference values. In the Centre-South there were even +1.63 °C on average
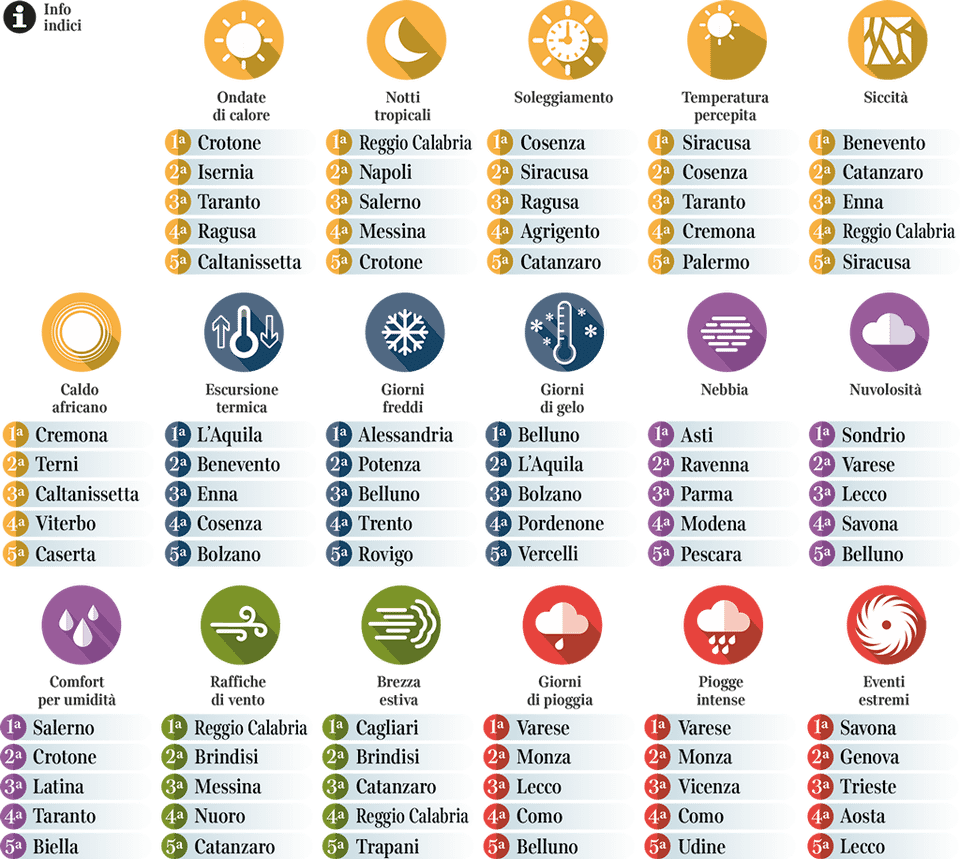
SUMMER BREEZE: average km/h of wind in the summer season – average of hourly wind values from 1 June to 31 August
HUMIDITY COMFORT: number of days per year of climatic comfort, i.e. when the humidity remains in the range >=30% and <=75% all day
THERMAL RANGE: annual average of the daily maximum – minimum temperature difference °C
COLD DAYS: number of days per year with maximum temperature < 3°C
FOG: number of days per year with visibility lower than 1000 metres
CLOUD: annual average cloud cover in %
HEAT WAVES: series of at least 4 consecutive days in which the daily average temperature is greater than the average plus a standard deviation of that day of the year calculated over the entire history since 2000
RAINY DAYS: number of days per year in which it rains for at least an hour with at least 1 mm
INTENSE RAIN: number of hours per year with intense rainfall (greater than 5 mm in 5 minutes or greater than 15 mm in an hour)
EXTREME EVENTS: number of days with at least 40 mm of precipitation + max wind gust > 30 km/h.
AFRICAN HOT: number of days per year with max temperature > 34°C
PERCEIVED TEMPERATURE: number of days per year with perceived temperature (Heat Index) >=32°C
DROUGHT: negative values of the SPI index (Standardized Precipitation Index) indicate a water deficit, greater drought. Values are between -2 (extreme drought) and +2.5 (extreme humidity)
TROPICAL NIGHTS: number of nights (time band 9pm – 8am) in the year with minimum temperature >= 20°C
WIND GUSTS: number of days per year with gusts > 30 km/h
FROST DAYS: number of days per year with min temperature <0°C
SUNSHINE: average hours of sunshine per day with irradiation of at least 300 watts per square meter
https://www.reddit.com/gallery/1r16b4i
Posted by sr_local
6 Comments
[removed]
Le orribili “infografiche” del corriere.
Dipende cosa si intende per miglior clima. Personalmente non voterei mai per Cagliari dopo aver percepito 50 gradi in estate
È davvero poco chiara. Che brutto modo di fare grafici di dati
Che bello essere cremonese
Infatti per questo si dice “vedi Napoli e poi muori”.