
I’m occasionally frustrated that my kids' developmental milestone achievements are reported purely as boolean: "By 9 months, he should be doing X." But obviously there is a distribution of when kids hit those milestones! It's just not easy to find what it looks like!
I found two datasets from large US studies that include actual parameter data for a variety of milestones.
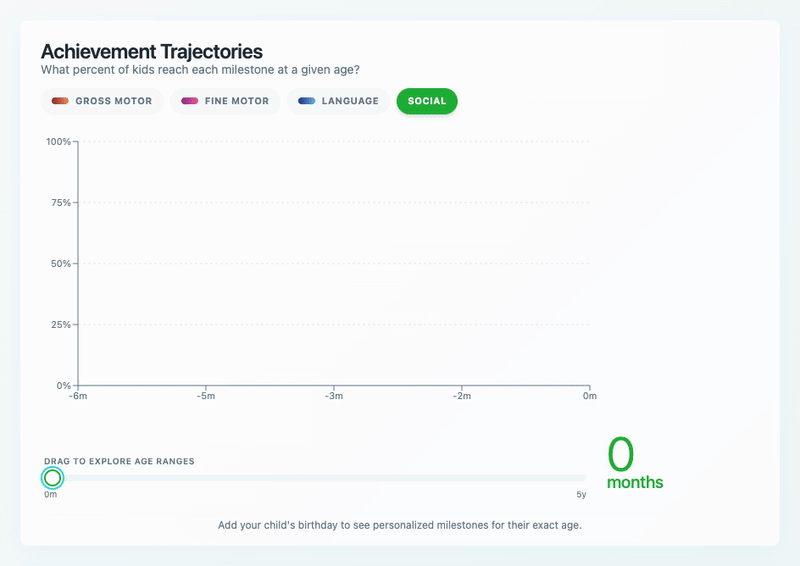
So I categorized the achievements and used those parameters to visualize them on a filterable, scrollable timeline.
link: https://kids.batna.dev/achievements
(Note that these are different than CDC milestones, and CDC uses different/more data to come up with their recommendations. Don't panic!)
Data Sources:
- Sheldrick, R. C., & Perrin, E. C. (2013). Evidence-Based Milestones for Surveillance of Cognitive, Language, and Motor Development. Based on a sample of 1,172 families.
- Frankenburg et al. (1990). Denver II Technical Manual for specific motor markers (Standing alone, etc.)
Tools:
- Item Characteristic Curve (ICC) parameters from the paper to produce the s-curves
- Recharts for plotting
Posted by palmeryan
13 Comments
Wow this has me thinking of new dystopian metrics that helicopter parents might use to determine if their kid is too far behind. Honestly I’m kinda not for this kind of measurement of children.
Amazing post. Data is useful, looks good, and is novel.
I once found a book my mum wrote and I just remember “he still colors over the lines” and I was devastated she judged my drawings and drew extra careful from that day on. Hahahaha
Unfortunately there’s no way to zoom in on the animation to make the text big enough to read.
Cool work! I noticed the labels on the y-axis don’t show up when viewed on mobile in vertical orientation. At least for me
This is really cool! My only feedback is after I added my kid on mobile I can’t seem to be able to go back and view the whole chart like your animation here, I am limited to seeing the milestones that are up to two months out for him.
someone posted and then deleted a question about which curve has the shallowest slope. Was a really fun question, and i don’t want to lose the answer so here it is:
oh fun question!
**Stays dry all night** takes over 6 years to go from 5% of kids to 95% of kids
* 5% mark: 21.9 months
* 95% mark: 96.5 months
I looked in the other direction too: there are a number of narrow ones that happen very early in the baby’s life, but a short one that happens a little later is **Gets to sitting** with <5 months dividing the earliest and latest achievers
* 5% mark: ~5.3 months
* 95% mark: ~10.2 months
Love everything but does this take into consideration individuals with developmental delays? It all seems to converge seemingly to 100%.
ok that’s pretty cool. I still get “yesterday” and “tomorrow” mixed up as an adult, so I hope that line never reaches 100%.
My only advice is if you’re a new parent… try not to obsess over stuff like milestones by age. Kids are all different and all humans have their strengths and weaknesses. You can’t really MAKE a kid develop faster than they are ready to, just be there for support and encouragement.
That said if you think they do need more support that’s fine but don’t push them because of a chart.
Being able to at least pause the video would be helpful.
maybe add a line for Autistic children for clarity
Do you know if these milestones are all actually normally distributed or did you have to make that assumption when creating these figures based off the available quartiles and medians?