It’s baffling that this is the best excuse they could come up with after how it worked out for them last time with Iraq.
Sir-Viette on
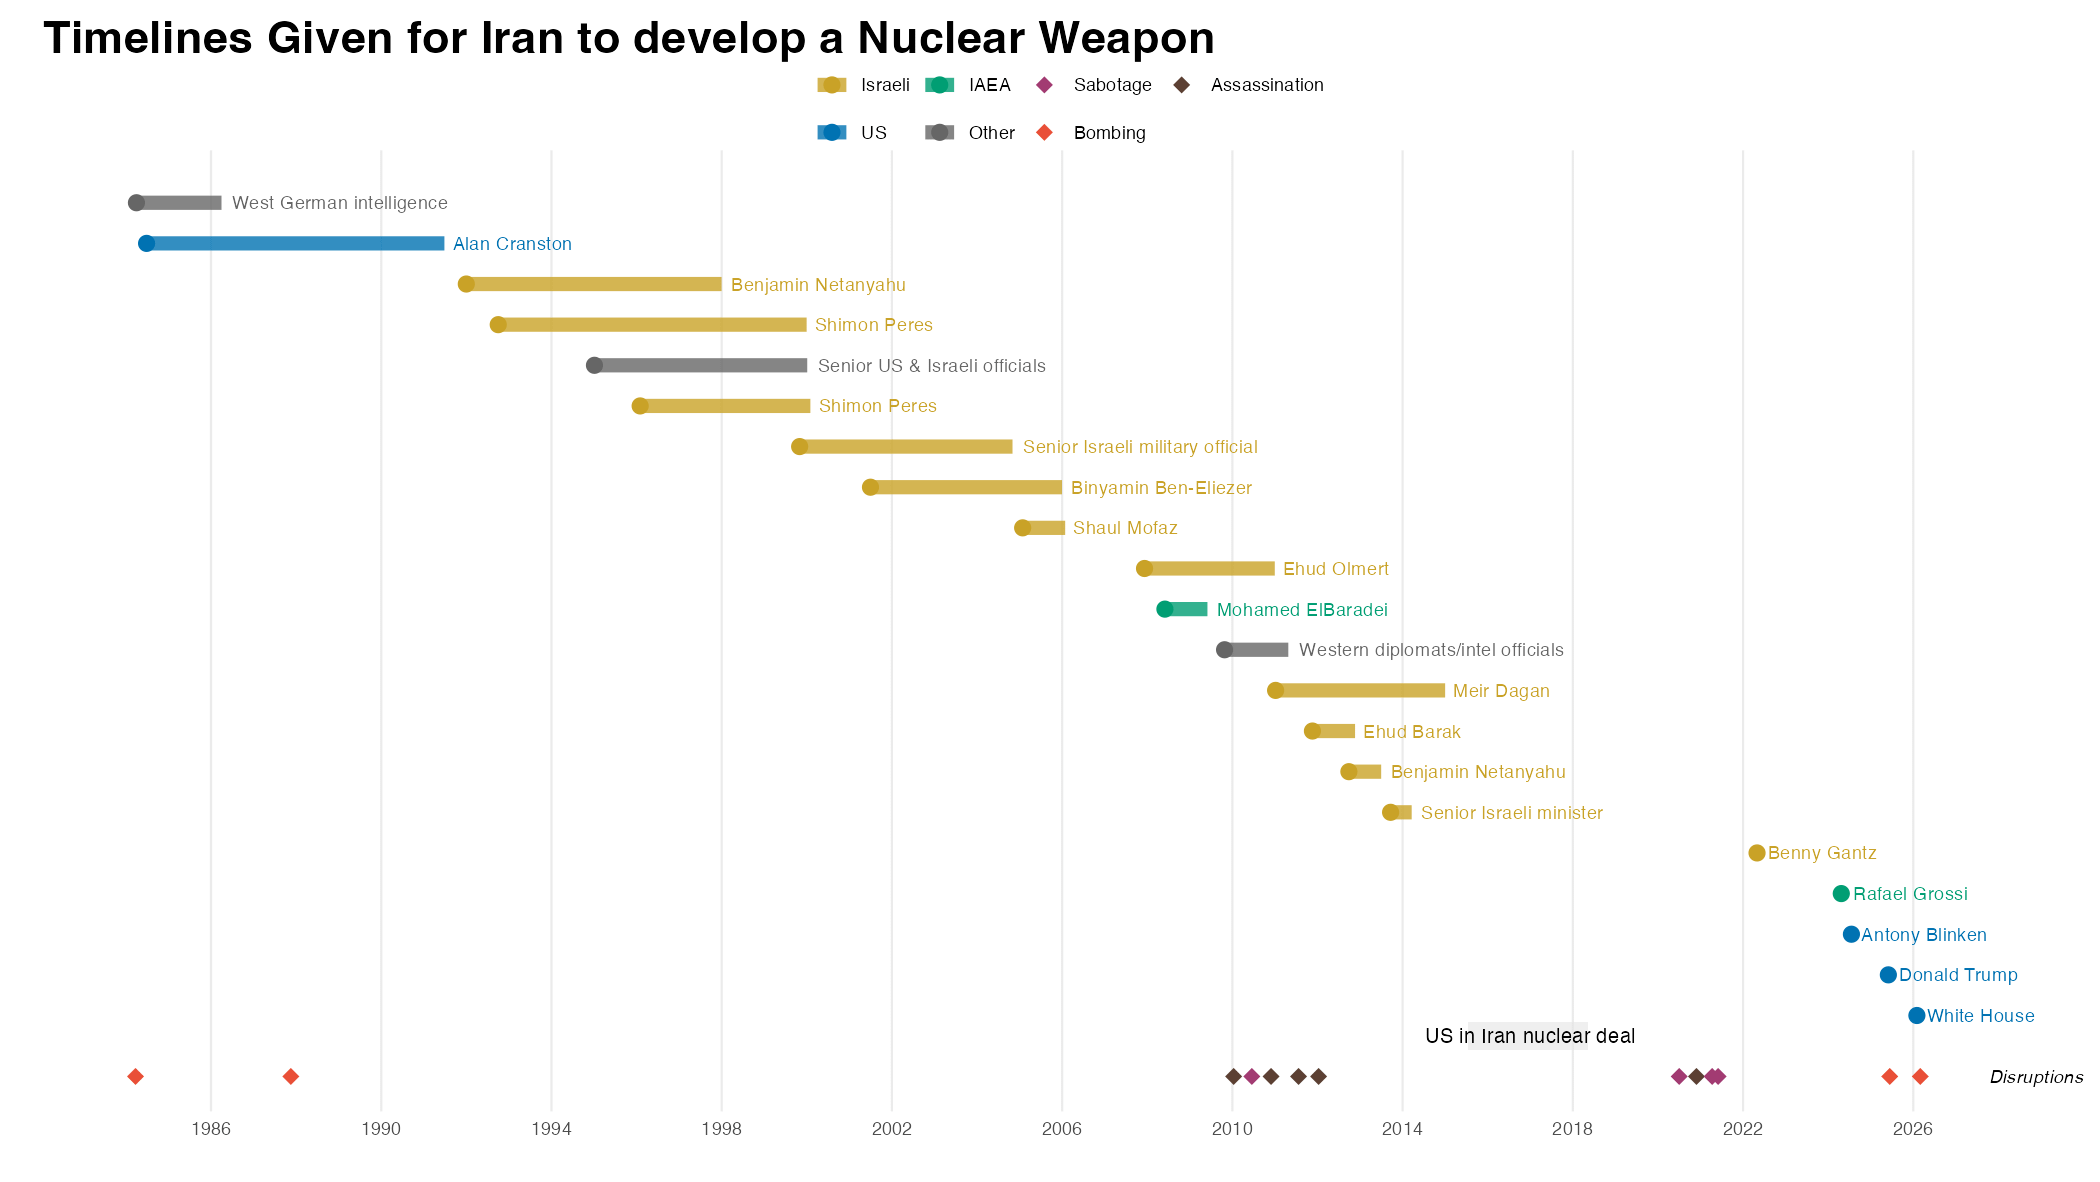
Excellent use of ggplot and data viz techniques. I like the consistent timeline down the bottom, the way you put the different projected timelines on separate lines, and the use of colour to indicate who said what.
If I could offer a point for improvement, the overall analysis misses the point. The reason that Iran has always been “close” to developing a nuclear bomb is because they keep different parts of it in different places. The uranium is in one warehouse, the missile body is in another, and the fuel is in another. Thus, they don’t have a bomb, but can put one together whenever they want at short notice. This is what has concerned world leaders for many years. So while your chart is technically correct, it contributes to disinformation.
However, as a piece of disinformation, it’s beautiful. I’ll bet it’ll convince lots of people in the thread to support the IRGC. Well done!
Brain_Aggravating on
I do not understand what the start and end of the line indicate. .. got it now. Perhaps the heading needs editing or an explanation to accompany the plot: Timelines given by individuals for Iran to develop a nuclear weapon, from the time the prediction was made.
Teeebs71 on
Bibi has been claiming Iran would have a nuke within two weeks for over 30 years…

![Timelines Given for Iran to develop a Nuclear Weapon [OC]](https://www.byteseu.com/wp-content/uploads/2026/03/xxwd6c4hb6ng1-1536x865.png "Timelines Given for Iran to develop a Nuclear Weapon [OC]")
5 Comments
R package ggplot2 code is [here](https://gist.github.com/cavedave/5e116cabcf0e116c67a7b78b0f10152c)
Data is linked to there. It is mainly from wikipedia a lot of them are from this article [here](https://opiniojuris.org/2013/01/28/yet-another-estimate-of-when-iran-will-have-the-bomb/)
It’s baffling that this is the best excuse they could come up with after how it worked out for them last time with Iraq.
Excellent use of ggplot and data viz techniques. I like the consistent timeline down the bottom, the way you put the different projected timelines on separate lines, and the use of colour to indicate who said what.
If I could offer a point for improvement, the overall analysis misses the point. The reason that Iran has always been “close” to developing a nuclear bomb is because they keep different parts of it in different places. The uranium is in one warehouse, the missile body is in another, and the fuel is in another. Thus, they don’t have a bomb, but can put one together whenever they want at short notice. This is what has concerned world leaders for many years. So while your chart is technically correct, it contributes to disinformation.
However, as a piece of disinformation, it’s beautiful. I’ll bet it’ll convince lots of people in the thread to support the IRGC. Well done!
I do not understand what the start and end of the line indicate. .. got it now. Perhaps the heading needs editing or an explanation to accompany the plot: Timelines given by individuals for Iran to develop a nuclear weapon, from the time the prediction was made.
Bibi has been claiming Iran would have a nuke within two weeks for over 30 years…