OC] I analyzed 30M+ US domestic flights (2020-2024). Florida dominates the worst airports, airlines improved but delays got worse, and Southwest cancelled 1 in 7 flights in Dec 2022.
Posted by Correct-Moment-2458

![OC] I analyzed 30M+ US domestic flights (2020-2024). Florida dominates the worst airports, airlines improved but delays got worse, and Southwest cancelled 1 in 7 flights in Dec 2022.](https://www.byteseu.com/wp-content/uploads/2026/03/ab8kuh7tukng1-1024x632.png "OC] I analyzed 30M+ US domestic flights (2020-2024). Florida dominates the worst airports, airlines improved but delays got worse, and Southwest cancelled 1 in 7 flights in Dec 2022.")
OC] I analyzed 30M+ US domestic flights (2020-2024). Florida dominates the worst airports, airlines improved but delays got worse, and Southwest cancelled 1 in 7 flights in Dec 2022.
Posted by Correct-Moment-2458
4 Comments
Tools: Python (matplotlib, pandas)
Source dataset (route-level + airport-level, 580K rows): [pivode.github.io](http://pivode.github.io)
Three angles from the same dataset:
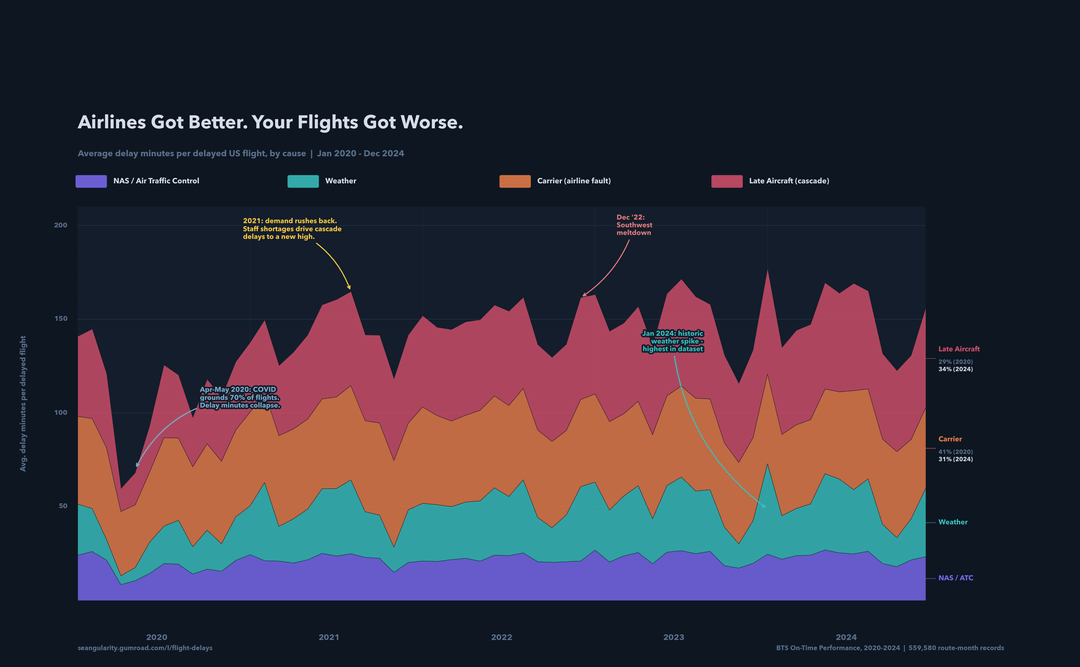
Chart 1 – Delay causes: Carrier delays (things airlines directly control) dropped from 41% of total delay time in 2020 to 31% in 2024. But the late aircraft cascade – one delayed plane making every downstream flight late – grew to fill the gap. Total delay minutes per delayed flight are higher now than before the 2021 demand surge.
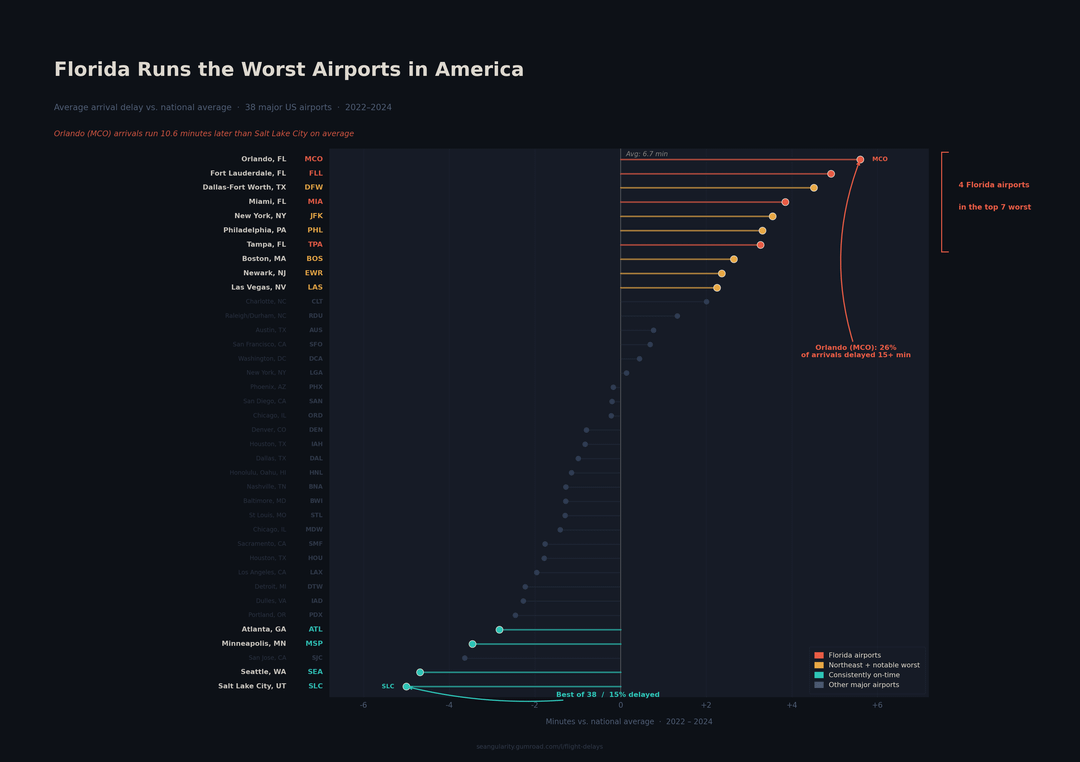
Chart 2 – Florida airports: Orlando (MCO) arrivals run 10.6 minutes later than Salt Lake City on average. 4 of the 7 worst-performing major airports are in Florida. Afternoon thunderstorm season and massive tourist volume on limited infrastructure. Only airports with 50K+ annual departures included.
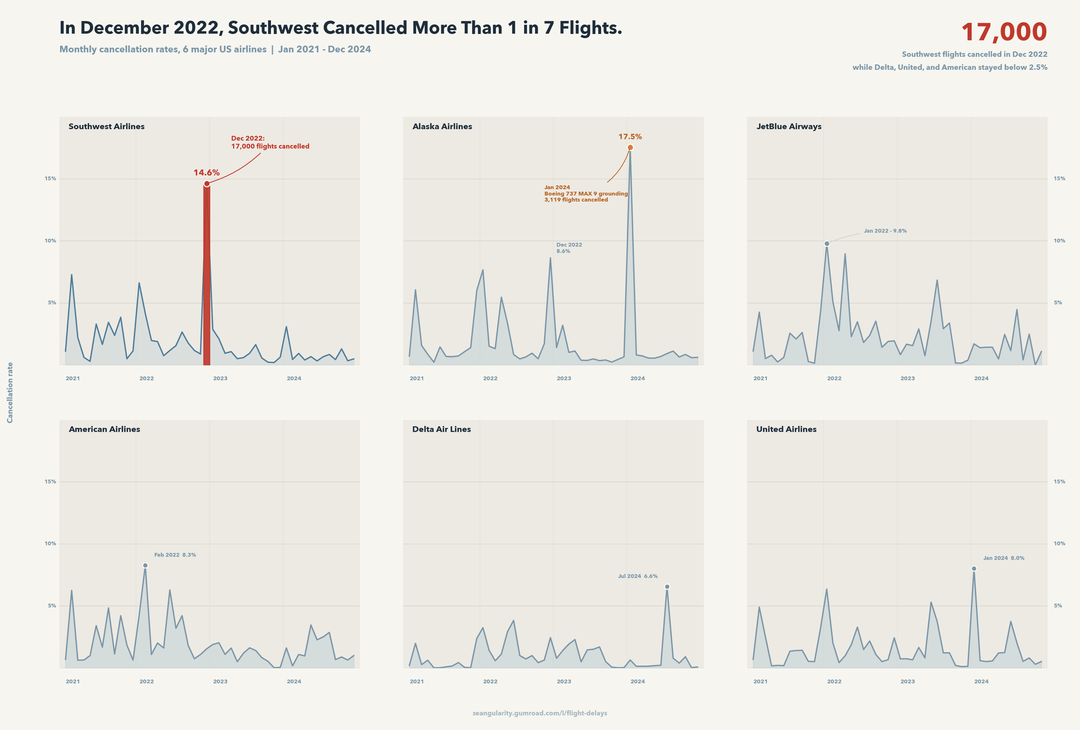
Chart 3 – Cancellations: The Southwest December 2022 meltdown hit 14.6% cancellation rate (~17,000 flights) while Delta, United, and American stayed below 2.5% the same month. Southwest’s point-to-point network couldn’t recover from cascading crew misplacements the way hub-and-spoke carriers could. The Alaska January 2024 spike (17.5%) is the 737 MAX 9 grounding after the door plug blowout.
Yeah I fly a lot. Like a lot lot. Miami is one of the worst airports on earth.
looks like more of the delay share is coming from late aircraft and system congestion, not pure carrier fault
Florida airports topping the worst list makes sense with all the weather issues down there.